Data Quality vs. Data Volume: What Actually Blocks Transformation
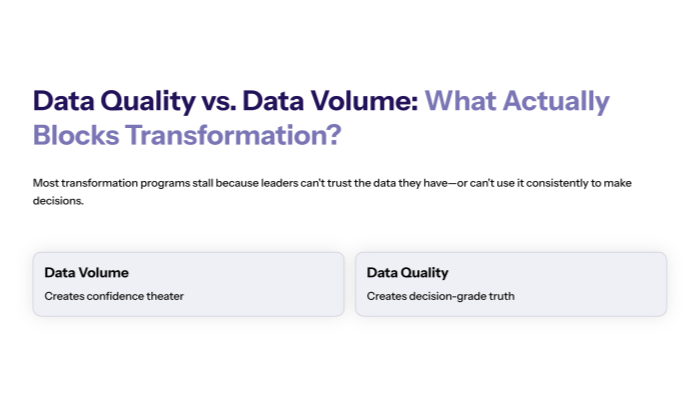
Most transformation programs don’t stall because the company lacks data. They stall because leaders can’t trust the data they have—or can’t use it consistently to make decisions.
RAPID is explicit about this: reliable information tells the real story, and intuition isn’t enough. It also frames transformation as a flywheel where you keep gathering data, reviewing progress, and feeding that learning back into decisions—because nothing operates in a frozen state.
That’s the real tension behind data quality vs. data volume:
Data volume can create confidence theater.
Data quality creates decision-grade truth.
Below is a RAPID-aligned guide to diagnosing what’s actually blocking transformation—and how to fix it without drowning the business in dashboards.

Why Data Volume Feels Like Progress But Isn’t?
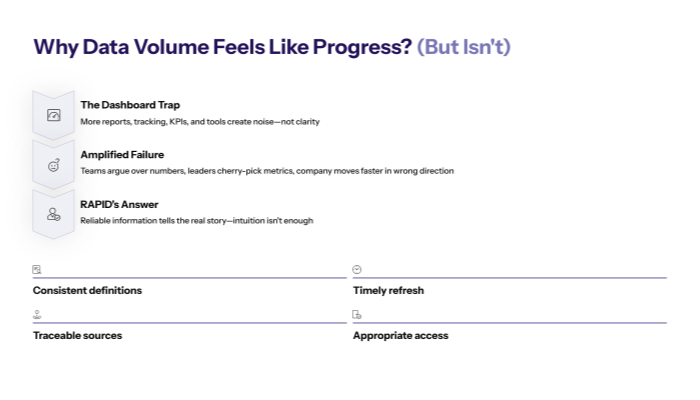
1.1 The dashboard trap: more data, less clarity
If an organization is struggling, the most common reflex is to “add visibility”:
- more reports
- more tracking
- more KPIs
- more tools
RAPID warns against this kind of misdirection through vanity metrics—numbers that make you look good but don’t help you understand performance in terms of future strategy.
High data volume can amplify the same failure pattern:
- Teams spend time arguing over whose numbers are “right.”
- Leaders choose the metric that supports the story they already believe.
- The company moves faster… in the wrong direction.
RAPID’s approach is the opposite: align every action around specific measurable outcomes, grounded in accurate information.
1.2 “Reliable information tells the real story”
RAPID calls this out directly: intuition is never enough—reliable information is what tells the real story, and the right research creates a factual basis for moving forward.
In practice, “reliable” usually means:
- consistent definitions (everyone measures the same thing)
- timely refresh (data is current enough to decide)
- traceable sources (you can explain where it came from)
- appropriate access (decision makers can see it)
If any of those fail, volume becomes noise—and noise becomes friction.
The Real Blockers: Timeliness, Consistency, and Shared Understanding
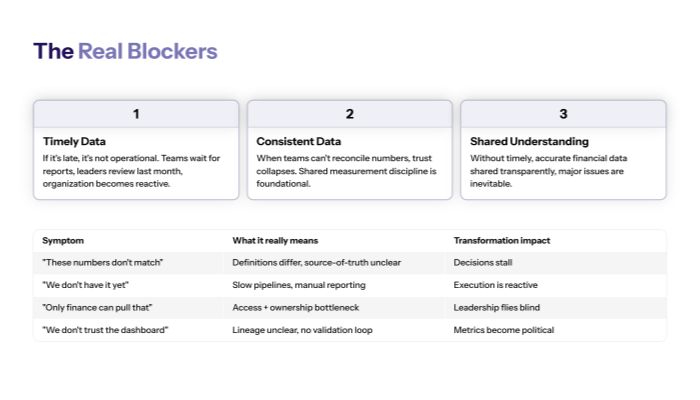
2.1 Timely data: if it’s late, it’s not operational
RAPID emphasizes that research is fluid and continuous—you keep gathering data and revisiting results because the business isn’t frozen.
That matters because “late data” creates late decisions:
- Teams wait for reports instead of acting.
- Leaders review last month while today’s system drifts.
- The organization becomes reactive, not outcomes-driven.
A practical litmus test:
If the data arrives after the decision deadline, it’s not decision support—it’s documentation.
2.2 Consistent data: when teams can’t reconcile numbers, trust collapses
RAPID highlights a classic example: leaders in different locations can’t even agree on the numbers because they ran reports at “the same time,” but didn’t consider time zones.
This sounds small, but it points to a larger problem: the organization lacks shared measurement discipline.
If you can’t get timely, accurate financial data and share it transparently with decision makers, RAPID argues that major issues are inevitable—and that this is something they “jump on pretty quickly” because it’s so foundational.
“Quality blockers” that look like “data problems”
Symptom |
What it really means |
Transformation impact |
|---|---|---|
“These numbers don’t match” |
definitions differ, source-of-truth unclear |
decisions stall |
“We don’t have it yet” |
slow pipelines, manual reporting |
execution is reactive |
“Only finance can pull that” |
access + ownership bottleneck |
leadership flies blind |
“We don’t trust the dashboard” |
lineage unclear, no validation loop |
metrics become political |
RAPID’s Answer: Decision-Grade Data, Not “All the Data”
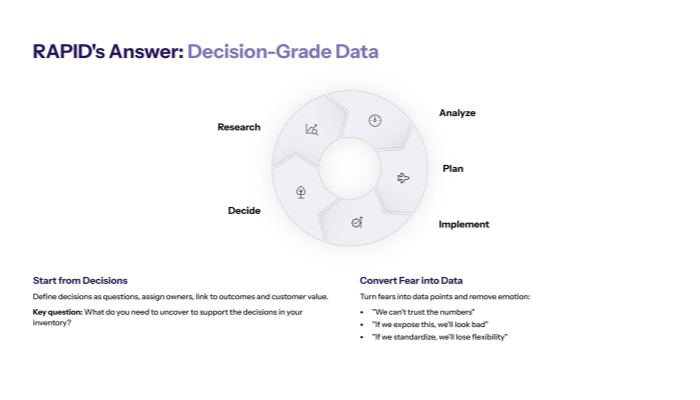
3.1 Start from decisions, not from dashboards
RAPID frames decision-making as the hardest and most important management task and provides a Decision Inventory to define decisions as questions, assign owners, and link them to outcomes and customer value.
This is the cleanest way to settle the data quality vs. data volume debate:
You don’t need all the data. You need the data required to make and support the decisions that drive outcomes.
RAPID even pushes you to ask: What do you need to uncover to support the decisions in your inventory?
That’s the playbook.
3.2 Convert fear and confusion into data points
RAPID treats fear as a signal and formalizes it in the Risks (Fears) Inventory: convert fears into fuel by turning them into data points and removing emotion.
This is directly relevant to data quality:
- “We can’t trust the numbers” is a fear.
- “If we expose this, we’ll look bad” is a fear.
- “If we standardize, we’ll lose flexibility” is a fear.
RAPID’s model is to capture these fears explicitly, then resolve them through clarity, evidence, and iterative follow-up.
A Practical Data Quality Playbook (RAPID-Aligned)
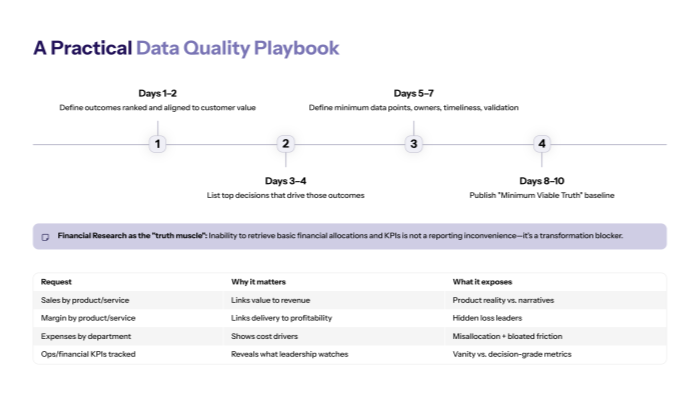
4.1 Build a “Minimum Viable Truth” baseline in 10 days
RAPID’s flywheel (Research → Analyze → Plan → Implement → Decide) is designed to move quickly, with measurement and iteration as a loop.
A fast, practical approach:
- Day 1–2: Define outcomes: Use Outcomes to define what matters (ranked, aligned to customer value).
- Day 3–4: Define decisions; List top decisions that drive those outcomes (Decision Inventory).
- Day 5–7: Define data required, For each decision, list:
- the minimum data points needed
- who owns the data
- what “timely” means
- what validation step proves it’s trustworthy
- Day 8–10: Publish the baseline: Publish a one-page “Minimum Viable Truth” spec:
- definitions
- sources of truth
- refresh frequency
- access rules
This turns data quality into an operating system component, not an IT project.
4.2 Use Financial Research as the “truth muscle”
RAPID includes Financial Research as a structured request for high-level directional data—usually available from the P&L—while acknowledging that if it isn’t readily available, that itself is a risk and a product gap.
This is crucial: inability to retrieve basic financial allocations and KPIs is not a reporting inconvenience—it’s a transformation blocker.
Financial Research requests (high leverage, low noise)
Request |
Why it matters |
What it exposes |
|---|---|---|
Sales by product/service |
links value to revenue |
product reality vs. narratives |
Margin by product/service |
links delivery to profitability |
hidden loss leaders |
Expenses by department |
shows cost drivers |
misallocation + bloated friction |
Ops/financial KPIs tracked |
reveals what leadership watches |
vanity vs. decision-grade metrics |
These requests force clarity—and clarity is the prerequisite to any “data-driven” transformation.
The Outcome: Data That Enables Execution (Not Debate)
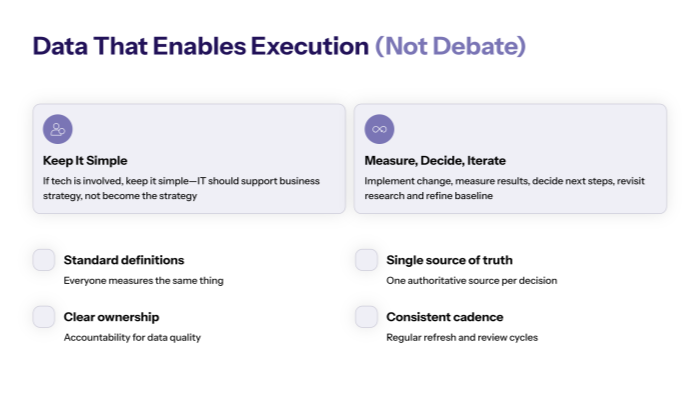
5.1 “If tech is involved, keep it simple”
RAPID is blunt: if technology is involved, keep it simple—IT should support business strategy, not become the strategy.
This applies directly to data programs:
- Don’t build a complex data platform to avoid making hard decisions.
- Don’t add tooling to compensate for unclear ownership.
- Don’t chase “one dashboard to rule them all” without decision clarity.
Data quality wins usually come from simple moves:
- standard definitions
- a single source of truth per decision
- clear ownership
- consistent cadence
5.2 Measure, decide, iterate (or you’ll drift)
RAPID asks a direct question: does your business measure the success of new initiatives tangibly—or does it move on without looking back?
That’s where data quality becomes the transformation flywheel:
- you implement a change
- you measure what happened
- you decide: stop, go, or change gears
- you revisit research and refine the baseline
When you do this, “data quality vs. data volume” stops being a debate and becomes a discipline: only collect what helps you decide and deliver outcomes.
Bottom line
Digital transformation is blocked less by a lack of data and more by a lack of trustworthy, timely, decision-grade data.
RAPID’s approach is to anchor measurement to outcomes, build a decision inventory, define the minimum data needed to support those decisions, and iterate through a feedback loop—so transformation stays real, measurable, and executable.