Ecommerce Platform Performance Monitoring: A Complete Guide for Post-Launch Operations
Ecommerce platform performance monitoring is the continuous post-launch practice of tracking whether an online store is fast, available, accurate, and able to convert website visitors into buyers without preventable friction. For an ecommerce business, performance monitoring is not limited to uptime; it connects system performance, customer experience, checkout health, inventory data, integrations, and revenue impact.
This guide covers the core areas operations teams need to monitor after launch: Core Web Vitals, checkout health, inventory synchronization, search performance, third-party integrations, observability, alerts, and revenue-impact monitoring. It is written for ecommerce operations teams, CTOs, platform managers, and technical leaders responsible for reliable performance across ecommerce platforms during normal traffic, peak traffic, and high traffic events.
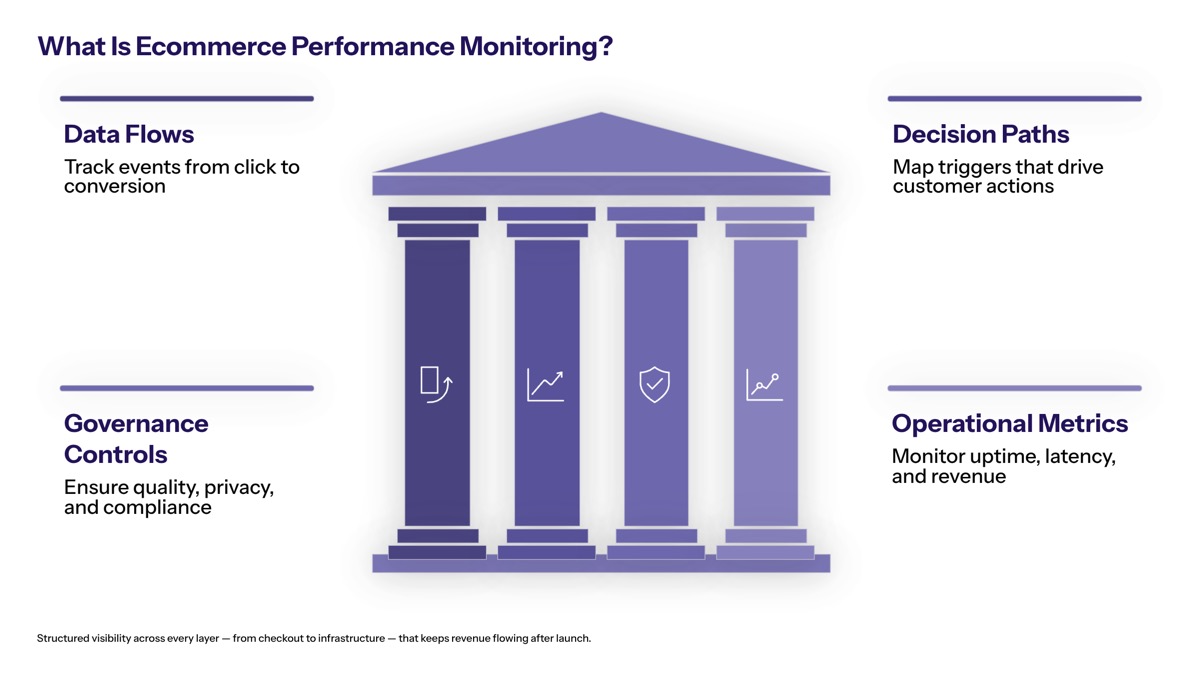
In direct terms, ecommerce platform performance monitoring involves continuous tracking of technical metrics, user experience indicators, and business KPIs to prevent revenue loss and maintain operational efficiency. Monitoring an eCommerce platform ensures high availability, fast load times, and seamless checkouts, impacting conversion rates.
By the end of this guide, you will understand how to achieve:
Improved uptime across the ecommerce site and connected systems
Faster issue detection and resolution during traffic spikes
Better customer experience across the full customer journey
Reduced revenue loss from checkout, inventory, search, and integration failures
Proactive system optimization using ecommerce metrics, key performance indicators, and performance metrics
Understanding Ecommerce Performance Monitoring
Ecommerce performance monitoring is the live, ongoing measurement of how an e commerce platform behaves after launch. It tracks production traffic, real customer behavior, server response, API Response Time, Error Rates, checkout completion, inventory accuracy, and business outcomes such as conversion rate, average order value, and customer lifetime value.
This differs from pre-launch testing. Before launch, teams run load tests, stress tests, QA scripts, and synthetic user journeys in controlled environments. After launch, the ecommerce site must handle real website traffic, real mobile users, unexpected traffic surges, payment provider issues, regional slowdowns, customer feedback, and changing traffic patterns that test environments rarely capture fully.
Post-launch monitoring is also where ecommerce scalability becomes visible. Scalability in eCommerce describes how your eCommerce platform responds to increased traffic, higher transaction volumes, and changing traffic patterns, ensuring that the system can handle the load without slowdowns or errors. Conducting regular load tests prepares eCommerce platforms for peak traffic during events like Black Friday, but live monitoring confirms whether the platform can actually manage traffic spikes when customer demand grows.
Technical Performance vs Business Performance
Technical performance metrics describe how stable, fast, and resilient the platform is. These include Time to First Byte, Page Load Time, API Response Time, Error Rates, database latency, cache hit ratios, CPU usage, memory pressure, queue depth, CDN behavior, and cloud infrastructure capacity. Time to First Byte (TTFB) measures how quickly the server responds to a browser request. Error Rates track the percentage of HTTP 5xx responses or application exceptions.
Business performance metrics describe whether the ecommerce business is achieving commercial goals. Ecommerce metrics provide a numerical snapshot of business performance, allowing companies to track success across various areas such as sales, marketing, and customer engagement. Key performance indicators (KPIs) are specific metrics that help evaluate the success of an ecommerce business in achieving its goals, serving as benchmarks for performance.
The connection between technical and business performance is direct. Sales Conversion Rate (CVR) is the percentage of visitors who complete a purchase and indicates the effectiveness of the sales funnel. The average conversion rate for eCommerce sites typically hovers around 2% to 3%. To calculate conversion rate, divide the number of conversions or sales by the total number of visitors, then multiply by 100 to get a percentage. Improving conversion rates can significantly impact overall revenue, as even small increases in conversion can lead to substantial financial gains for eCommerce businesses.
Other business indicators matter as well. Website traffic is a key ecommerce metric that measures the number of users visiting a site, helping businesses assess brand awareness and the effectiveness of their marketing efforts. The average order value (AOV) is an important ecommerce metric that indicates how much customers typically spend per transaction, providing insights into pricing strategies and customer buying patterns. Customer lifetime value (LTV) is a metric that predicts the total revenue a business can expect from a customer throughout their entire relationship with the brand.
A healthy customer lifetime value indicates strong customer retention and engagement, which are critical for long-term business success. To calculate customer lifetime value, businesses can use the formula: Customer Lifetime Value = Average Order Value x Purchase Frequency x Average Customer Lifespan. Understanding customer lifetime value helps businesses assess whether their customer acquisition costs are sustainable and informs marketing budget decisions.
Customer acquisition cost (CAC) is calculated by dividing total marketing and sales expenses by the number of customers acquired during a specific period. A lower customer acquisition cost is generally preferred as it indicates more efficient marketing strategies and higher profitability. To optimize customer acquisition costs, businesses can focus on better targeting, refined customer segmentation, and creating streamlined marketing journeys.
Real-Time vs Historical Monitoring
Real-time monitoring detects problems while they are happening. It is essential for issues such as payment gateway failures, checkout errors, API latency spikes, search outages, missing inventory updates, or sudden drops in online sales. API Latency measures the response times of critical third-party services such as payment gateways. Order Volatility indicates sudden drops in hourly order volume, which usually signal a broken checkout pipeline.
Historical monitoring explains patterns over time. It helps teams compare current ecommerce data with previous weekends, marketing campaigns, seasonal peaks, paid ads performance, product launches, and global ecommerce sales trends. Historical views are especially useful for identifying slow degradation caused by code bloat, database growth, cache misconfiguration, third-party scripts, or cloud platforms that no longer match demand.
A strong monitoring program uses both. Real-time dashboards help teams respond immediately; historical analysis helps teams make informed decisions, understand customer behavior, and plan for future growth. Tracking ecommerce metrics and KPIs enables businesses to make informed decisions, understand customer behavior, and strategize for future growth, ultimately providing a competitive edge in the market.
The next step is knowing which areas of the ecommerce platform need continuous tracking, from website performance to checkout, inventory, search, and integrations.
Core Performance Monitoring Areas
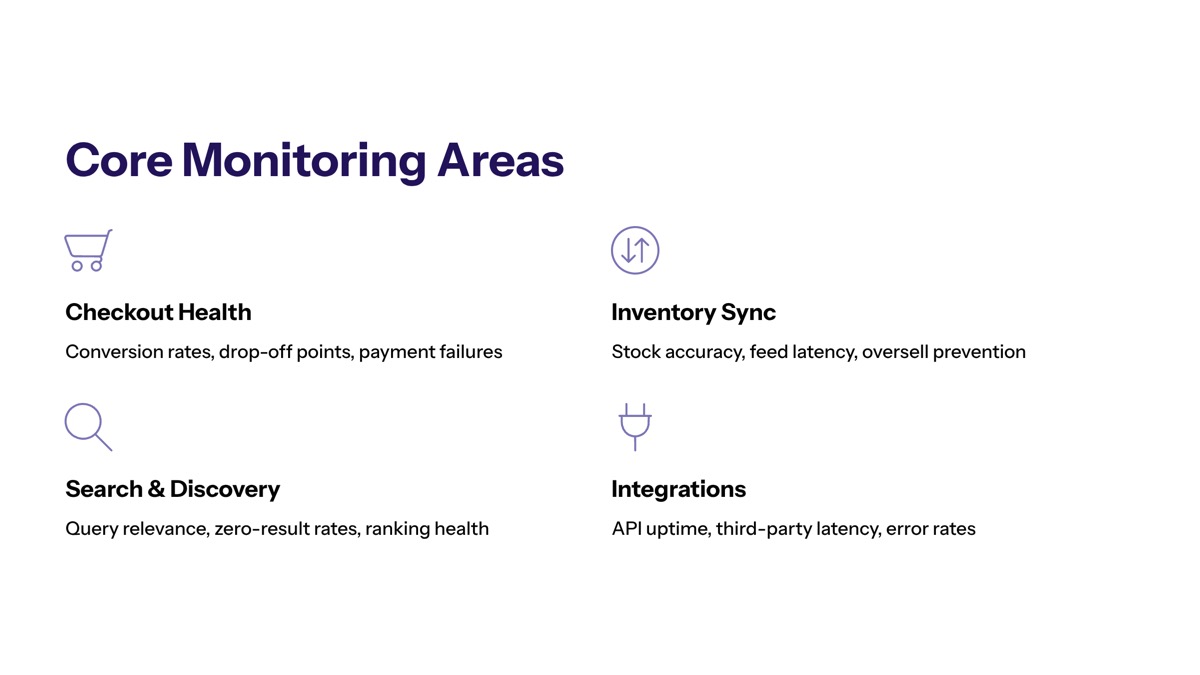
Once the foundational monitoring model is clear, operations teams can focus on the areas most likely to affect customer satisfaction and revenue. The highest-priority areas are Core Web Vitals, checkout process health, inventory synchronization, search performance, third-party integrations, and revenue-impact signals such as conversion rate, average order value, customer retention rate, and customer lifetime value.
Core Web Vitals and User Experience Metrics
Core Web Vitals are key metrics that measure page experience for real users. Largest Contentful Paint (LCP) refers to the time it takes for the main page content to load. Cumulative Layout Shift (CLS) measures unexpected movement of page elements while the page loads. First Input Delay (FID) appeared in many older dashboards, but Interaction to Next Paint (INP) is now the more complete responsiveness metric; Interaction to Next Paint (INP) measures page responsiveness when a user interacts with the page.
These metrics affect SEO, customer experience, and conversion rate. Page Load Time should ideally be under 2 seconds, as additional seconds can exponentially increase bounce rates. Ecommerce teams should monitor LCP, INP, CLS, TTFB, full Page Load Time, JavaScript errors, and API Response Time across the homepage, category pages, product detail pages, search results, cart, and checkout.
Segmentation is critical. Segmentation of performance metrics by device type, traffic source, or new versus returning customers helps tailor user experiences and improve conversion rates. Mobile users often experience slower pages than desktop users because of network quality, device CPU limits, heavy scripts, and less stable connections. For that reason, ecommerce performance monitoring should separate mobile, desktop, tablet, geography, browser, customer segments, and paid ads traffic.
Measuring performance should combine quantitative data with qualitative insights to optimize the customer journey and identify friction points. Implementing Real User Monitoring (RUM) captures actual visitor experiences across different devices and browsers. Using behavior analytics tools such as Hotjar allows visualization of user interactions, aiding in identifying user confusion areas on eCommerce sites. Google Analytics, Adobe Analytics, RUM tools, session replay, and customer feedback together provide a more complete picture than raw data alone.
Checkout Process Health
Checkout health deserves the highest monitoring priority because small failures become immediate lost revenue. Teams should monitor cart additions, checkout starts, payment attempts, payment approvals, order confirmations, failed submissions, validation errors, gateway timeouts, and Order Volatility. If hourly orders drop sharply while website traffic remains stable, the issue may be a broken checkout pipeline rather than a demand problem.
Payment monitoring should include payment gateway response times and failure rates across credit cards, wallets, PayPal, buy-now-pay-later providers, and local payment methods. API Latency measures the response times of critical third-party services such as payment gateways, while API Response Time monitors the speed at which the backend communicates with databases or third-party services. When API latency rises, customers may retry payments, abandon carts, or contact support.
The cart abandonment rate represents the percentage of shoppers who add items to their cart but leave the site before completing the purchase, indicating friction in the checkout process. Most online retailers lose between 60% to 80% of their shopping carts, with top performers only losing about 25%. A high cart abandonment rate often signals problems in the final steps of the customer journey, such as surprise fees, slow load times, or a lack of payment options.
Checkout monitoring should connect technical events to customer behavior. If cart abandonment increases after a release, the cause may be a slow tax calculation API, hidden shipping costs, forced account creation, form validation errors, limited payment methods, or mobile usability problems. This is why successful ecommerce operations teams combine logs, session replay, funnel analytics, customer sentiment, and customer satisfaction data.
Inventory and Search Performance
Inventory monitoring protects trust. If inventory synchronization fails across warehouses, marketplaces, retail stores, and the ecommerce site, customers may buy items that are unavailable or see products as out of stock when inventory exists. Real-time inventory synchronization monitoring should track inventory data freshness, sync latency, failed updates, queue backlogs, ERP or WMS errors, and mismatches between the online store and fulfillment systems.
Catalog propagation also needs monitoring. Product launches, pricing changes, promotions, product images, variants, and stock levels often depend on caches and content delivery networks. If cache invalidation fails, customers may see stale prices, unavailable variants, or outdated promotions. Frequently accessed data should be cached for performance, but cache rules must not prevent accurate product catalog updates.
Search performance affects discovery and average order value. Teams should monitor query response time, result accuracy, zero-result searches, autocomplete latency, typo tolerance, filter latency, sorting behavior, and personalization logic. Slow or inaccurate search prevents customers from finding products, weakens marketing performance, and reduces online sales.
This area is also tied to ecommerce scalability. A scalable eCommerce platform allows businesses to handle rapid growth, traffic fluctuations, and new customer demand without recurring performance issues, which is crucial during peak shopping periods. To effectively scale an eCommerce platform, it is essential to optimize frontend performance, utilize cloud infrastructure, and implement load balancing to manage increased traffic without performance degradation.
Flexible infrastructure in eCommerce enables platforms to respond to traffic fluctuations dynamically, scaling resources up during high traffic and down when demand drops, thus maintaining stable performance. Headless commerce architecture separates the frontend from backend logic, allowing each layer to scale independently, which is beneficial for managing varying traffic sources and demands.
Third-Party Integration Monitoring
Modern ecommerce platforms depend on external systems. Payment processors, tax engines, shipping carriers, fraud detection providers, marketing tags, recommendation engines, CDNs, ERP systems, WMS platforms, CRM tools, and analytics suites all affect customer experience and system performance.
API health monitoring should track uptime, API Latency, API Response Time, error rates, timeout rates, retries, malformed responses, and vendor status. For revenue-critical services, teams should monitor each provider independently rather than relying only on internal application logs. A payment processor may report partial degradation before the ecommerce platform shows widespread checkout failure.
Integration failure detection should include automated failover mechanisms where possible. Examples include routing payments to a backup gateway, switching shipping rate providers, disabling noncritical marketing scripts, or serving cached search results during a search provider outage. Seamless integration does not mean every dependency will be perfect; it means the platform can degrade gracefully when one system fails.
Data flow monitoring is equally important. Order data must move from checkout to ERP, fulfillment, inventory, shipping notifications, customer service, and analytics platforms. If those flows break, existing customers may receive incorrect order updates, repeat customers may lose confidence, and customer relationships may suffer. Centralizing logs from applications, servers, and CDNs into a single dashboard helps streamline monitoring efforts and makes root-cause analysis faster.
These monitoring areas become manageable when they are supported by a practical observability strategy.
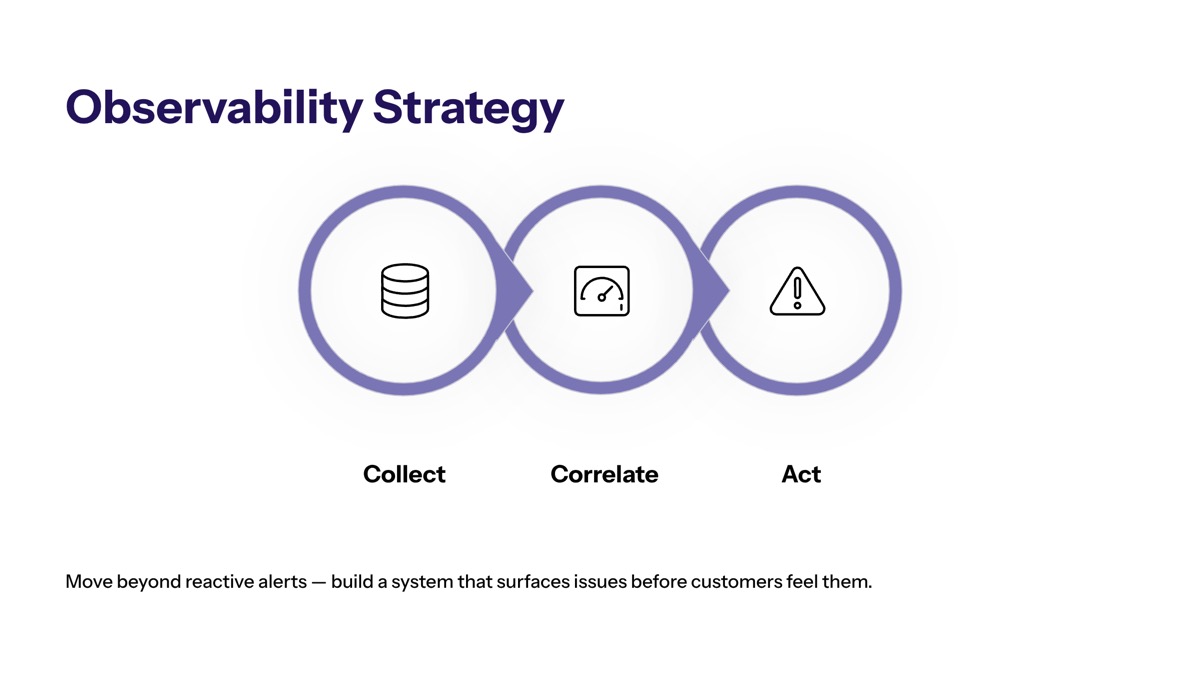
Monitoring Implementation and Observability Strategy
A strong observability strategy turns raw data into actionable insight. For growing e commerce businesses, especially those operating a scalable ecommerce platform across multiple markets, monitoring must cover frontend experience, backend services, cloud infrastructure, third-party integrations, logs, traces, ecommerce metrics, and business KPIs.
Observability Stack Setup
Comprehensive observability becomes necessary when an ecommerce business moves beyond simple storefront operations into multiple systems, multiple servers, multiple markets, high traffic periods, or complex customer journeys. At that stage, teams need more than a basic uptime checker.
Configure application performance monitoring. APM tools collect response times, traces, exceptions, service dependencies, API Response Time, and Error Rates. Distributed tracing helps teams identify whether latency comes from the frontend, backend, database, cache, payment gateway, or another dependency.
Monitor infrastructure and cloud resources. Infrastructure monitoring should cover cloud platforms, cloud native infrastructure, containers, databases, queues, content delivery networks, load balancers, CPU, memory, disk I/O, and network health. This is essential to handle traffic spikes, manage traffic spikes, and maintain reliable performance during peak demand.
Centralize logs for faster troubleshooting. Centralizing logs from applications, servers, and CDNs into a single dashboard helps streamline monitoring efforts. Structured logs with correlation IDs allow teams to connect a failed checkout, an API timeout, a CDN cache miss, and a database query into one incident timeline.
Use Real User Monitoring and synthetic monitoring together. Implementing Real User Monitoring (RUM) captures actual visitor experiences across different devices and browsers. Using synthetic monitoring simulates user journeys to track and optimize interactions on eCommerce platforms. Synthetic monitoring should test browsing, search, add-to-cart, checkout, payment authorization, and order confirmation from multiple regions.
Connect technical monitoring to revenue metrics. Dashboards should show conversion rate, average customer order behavior, average order value, cart abandonment, customer acquisition cost, customer lifetime value, customer retention rate, and marketing spend alongside system performance. This helps teams prioritize incidents based on business impact, not only technical severity.
Alert Configuration and Response
Alerting should protect revenue without overwhelming the team. If every minor traffic fluctuation creates a notification, teams stop trusting alerts. If alerts are too weak, teams discover failures through customer complaints or lost online sales.
Alert Type | Trigger Threshold | Response Time | Escalation Path |
|---|---|---|---|
Revenue-impacting | Checkout failure >5% | Immediate | On-call → Management |
Performance degradation | Page load >3 seconds | 15 minutes | Operations → Development |
Integration failures | API error rate >2% | 30 minutes | Integration team → Vendors |
Thresholds should be based on baseline performance metrics and business tolerance. For example, an ecommerce site may treat checkout failure above 5% as urgent, but a smaller rise may still matter during high traffic events. Page load thresholds should be segmented by page type, device, and geography because mobile users on slower connections may show different patterns than desktop users.
Use percentiles rather than only averages. P75, P90, and P99 metrics reveal the experience of slower sessions that averages hide. A platform may look healthy on average while the slowest 5% of mobile visitors face checkout timeouts.
Alert response should include clear ownership. Revenue-impacting alerts should notify on-call engineers and management immediately. Performance degradation can route to operations first, then development. Integration failures should reach the integration team and vendors quickly. Teams should also document runbooks, maintenance windows, rollback procedures, and communication protocols.
This structure helps teams solve common monitoring challenges before they become recurring operational problems.
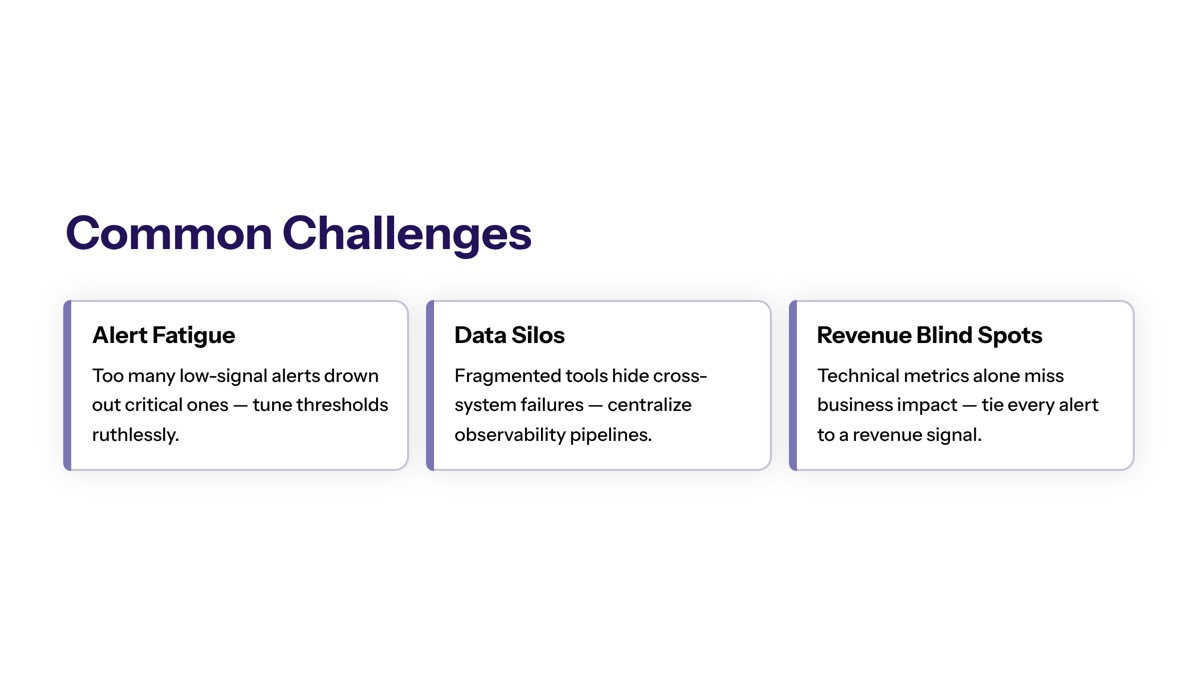
Common Challenges and Solutions
Even mature ecommerce operations teams struggle with noisy alerts, fragmented dashboards, rising monitoring costs, and unclear ownership. The solution is not simply adding more tools; it is designing monitoring around customer experience, revenue impact, system performance, and team workflows.
Alert Fatigue and False Positives
Alert fatigue happens when teams receive too many low-value notifications. False positives often come from static thresholds, short-lived network blips, duplicated alerts, or alerts that are not tied to customer impact.
Use intelligent alerting with machine learning-based anomaly detection to reduce noise while maintaining coverage. Alert correlation and suppression rules can group related issues, such as multiple API failures caused by one vendor outage. Teams should also define separate thresholds for normal traffic, peak traffic, marketing campaigns, and high traffic periods.
The best alerts are tied to outcomes. A spike in CPU usage may not require immediate escalation, but checkout failure, Order Volatility, payment API latency, or a conversion rate drop should be treated as revenue-impacting.
Cross-Team Visibility and Communication
Performance monitoring fails when only one team can interpret the data. Developers need traces, logs, and API errors. Operations teams need uptime, infrastructure health, incident status, and capacity trends. Business teams need conversion rate, website traffic, average order, customer satisfaction, customer sentiment, marketing performance, and revenue impact.
Create shared dashboards accessible to development, operations, and business teams with role-appropriate metric views. Google Analytics and Adobe Analytics can help business teams understand customer behavior, traffic source quality, marketing efforts, and customer segments, while APM and log platforms help technical teams diagnose root causes.
Communication protocols should be established before incidents. Define who owns customer updates, who posts to status pages, who contacts vendors, who briefs executives, and how often stakeholders receive updates. During traffic surges, clear communication protects customer trust as much as technical recovery does.
Balancing Monitoring Costs with Coverage
Monitoring everything at full detail can become expensive. Storage, data ingest, synthetic checks, RUM volume, log retention, and enterprise tool licensing can grow quickly as website traffic increases.
Prioritize monitoring investments based on revenue impact. Checkout, payment, inventory synchronization, search, product pages, and high-value customer segments should receive deeper monitoring than low-risk features. Use tiered monitoring: full fidelity for revenue-critical flows, sampling for lower-risk flows, and longer-term aggregation for historical analysis.
Sampling and intelligent data retention policies help control monitoring infrastructure costs. Keep detailed traces and logs for recent incidents, then downsample older raw data into trend-level metrics. This approach keeps enough history for informed decisions without letting monitoring spend overtake the value it creates.
The practical next step is to audit current gaps, connect technical monitoring with ecommerce metrics, and build an operating rhythm around continuous improvement.
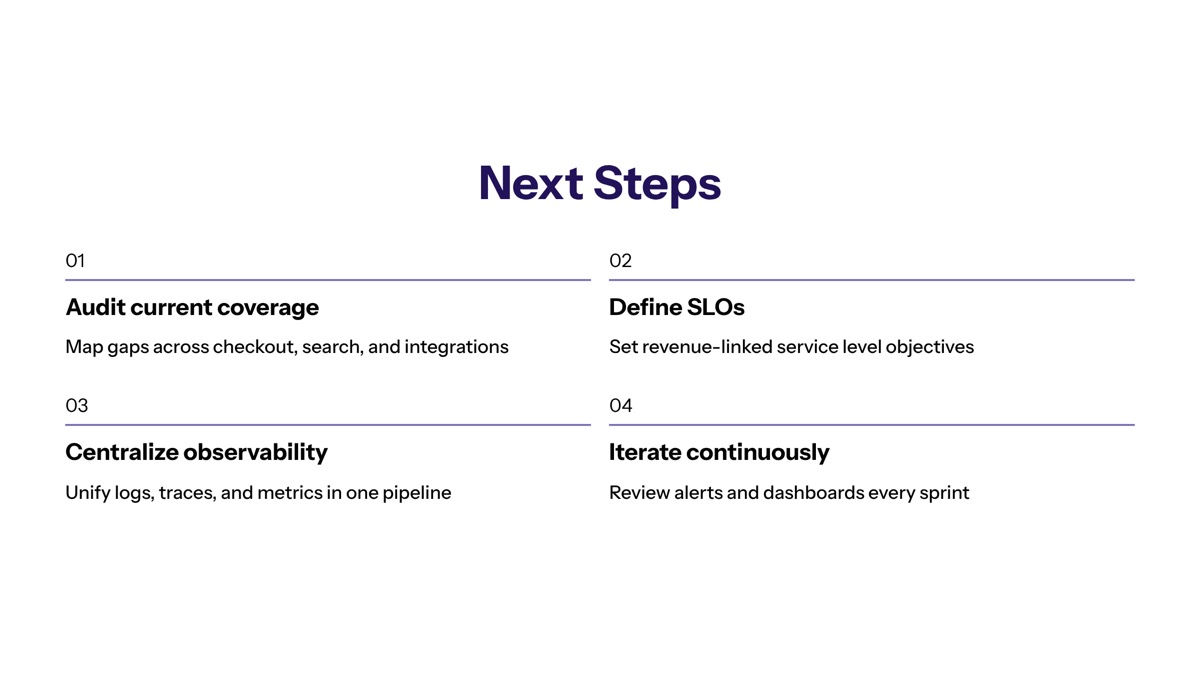
Conclusion and Next Steps
Effective ecommerce platform performance monitoring protects revenue, customer loyalty, and competitive advantage after launch. It gives teams visibility into Core Web Vitals, checkout health, inventory data, search performance, third-party integrations, cloud infrastructure, customer behavior, and key performance indicators that influence online sales.
Start with the highest-impact actions:
Audit current monitoring gaps. Review website performance, checkout errors, API latency, inventory sync, search performance, Error Rates, and Order Volatility.
Implement Core Web Vitals tracking. Monitor LCP, INP, CLS, TTFB, and Page Load Time by device, page type, region, and traffic source.
Establish baseline performance metrics. Define normal conversion rate, cart abandonment, average order value, customer acquisition cost, customer lifetime value, website traffic, and checkout completion rates.
Configure a comprehensive observability stack. Combine APM, infrastructure monitoring, centralized logs, Real User Monitoring, synthetic monitoring, and third-party integration monitoring.
Train teams on alert response. Create runbooks, escalation paths, ownership rules, and communication protocols for revenue-impacting incidents.
Establish regular performance review cycles. Review ecommerce data weekly or monthly, analyze incidents, update thresholds, and use customer feedback to improve the customer journey.
Related areas worth exploring include ecommerce platform modernization, AI-driven automation for monitoring, headless architecture, cloud native infrastructure, and RAPID framework implementation for systematic monitoring improvements.
Additional Resources
Core Web Vitals tools: Google PageSpeed Insights, Chrome User Experience Report, Lighthouse, Search Console, and RUM platforms for field data.
Analytics tools: Google Analytics, Adobe Analytics, ecommerce funnel dashboards, and behavior analytics tools such as Hotjar.
Monitoring tools: APM platforms, log aggregation systems, synthetic monitoring tools, infrastructure monitoring, and error tracking platforms.
Open-source options: Prometheus, Grafana, OpenTelemetry, ELK stack, and other tools for budget-conscious monitoring implementations.
Performance checklist: Track LCP, INP, CLS, TTFB, Page Load Time, API Response Time, API Latency, Error Rates, checkout failure, cart abandonment, inventory sync delay, search latency, conversion rate, average order value, customer acquisition cost, and customer lifetime value before every major launch or update.