Execution Metrics: What to Track Weekly (Not Quarterly)
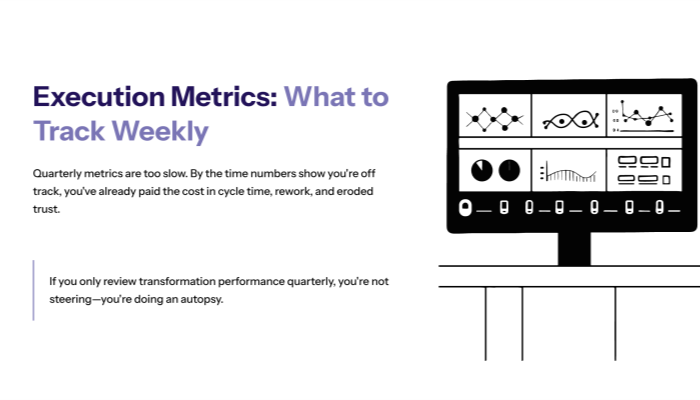
If you only review transformation performance quarterly, you’re not steering—you’re doing an autopsy.
Quarterly metrics are too slow for execution. By the time the numbers show you’re off track, you’ve already paid the cost in cycle time, rework, missed commitments, and eroded trust.
RAPID’s discipline is built around measurable outcomes and decision-making. If you can’t measure success in tangible ways, you can’t evaluate initiatives—and you’ll keep funding work that doesn’t move outcomes. And after implementation, you must evaluate results and decide to stay, change, or stop based on what happened.
That requires weekly execution metrics—especially metrics that expose the bottleneck.

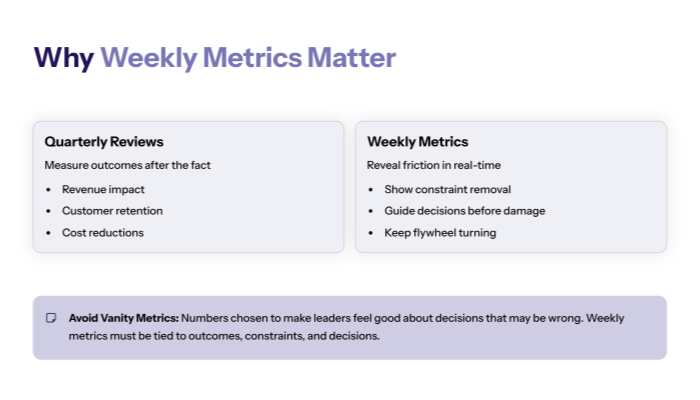
Why weekly execution metrics matter more than quarterly dashboards?
1.1 Transformation fails when metrics lag behind reality
Quarterly reviews tend to measure outcomes after the fact:
- revenue impact
- customer retention
- cost reductions
- operational performance averages
Those are useful—but they’re lagging indicators. They don’t help you correct course this week.
Weekly execution metrics are different:
- they reveal friction in the operating model
- they show whether constraint removal is working
- they guide decisions before damage compounds
RAPID treats transformation like a flywheel: better information → better analysis → better planning → better implementation → better decisions. Weekly metrics are the “information” that keeps the flywheel turning.
1.2 Vanity metrics are the fastest way to lose the week
RAPID warns against vanity metrics—numbers chosen to make leaders feel good about decisions that may be wrong. Weekly dashboards are vulnerable to vanity because people want quick wins.
So your weekly execution metrics must be:
- tied to outcomes
- tied to the constraint
- decision-driving
- hard to game
If a metric can improve while the system gets worse, it’s not a weekly execution metric—it’s noise.
The RAPID weekly measurement model (Outcomes → Constraints → Decisions)
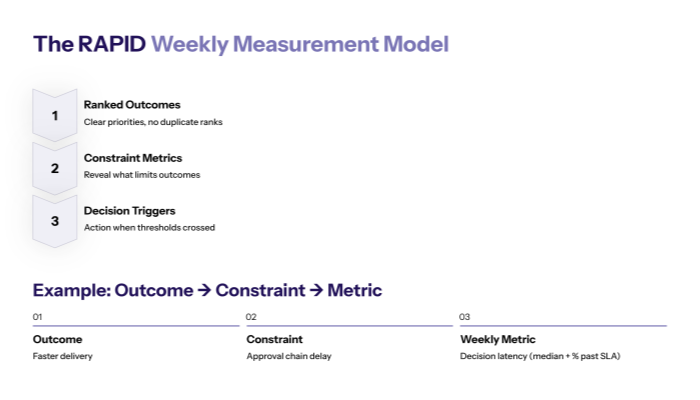
2.1 Start from ranked outcomes, then choose constraint metrics
Weekly metrics should not be “everything we can track.” They should be the minimal set required to steer the ranked outcomes.
RAPID forces outcomes clarity and prioritization (no duplicate ranks), and ties them to customer value.
Once outcomes are clear, choose metrics that reveal the constraint limiting them.
Example outcome → constraint → metric:
- Outcome: faster delivery
- Constraint: approval chain delay
- Weekly metric: decision latency (median + percent past SLA)
That’s how weekly execution metrics stay relevant.
2.2 Tie metrics to the Decision Inventory (metrics must trigger decisions)
RAPID’s Decision Inventory is designed to identify decisions that drive outcomes and customer value, assign owners, and prioritize decisions.
A weekly metric should answer:
- “What decision does this metric inform?”
- “Who owns the decision?”
- “What action triggers if the metric crosses a threshold?”
If you can’t answer those, you don’t need that metric weekly.
The 10 weekly execution metrics that actually steer transformation
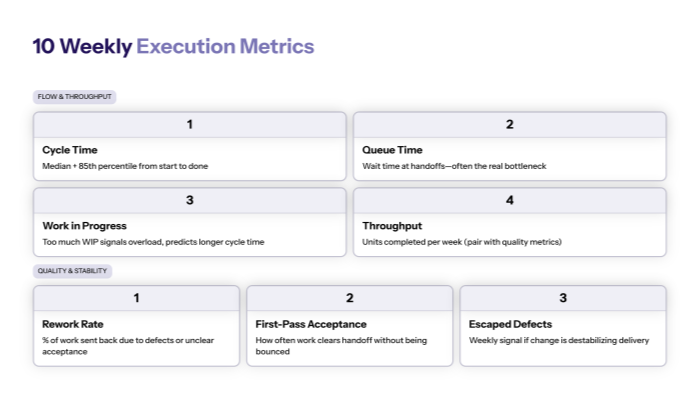
3.1 Flow and throughput (how fast work moves)
These metrics reveal system speed and bottlenecks:
- Cycle time (median + 85th percentile)
End-to-end time from “start” to “done” for your key workflow.
- Queue time / wait time at handoffs
Time work sits waiting for the next owner (often the real bottleneck).
- Work in Progress (WIP)
Too much WIP signals overload and predicts longer cycle time.
- Throughput
Units completed per week (must be paired with quality metrics).
These are the heartbeat metrics. They should move when constraints are removed.
3.2 Quality and stability (whether speed is real or fragile)
Speed without quality is fake progress.
- Rework / return rate
Percentage of work sent back due to missing inputs, defects, or unclear acceptance.
- First-pass acceptance rate
How often work clears a handoff without being bounced back.
- Escaped defects / incidents (if relevant)
A weekly signal of whether change is destabilizing delivery.
RAPID’s measurement philosophy is outcome-driven: if you can’t measure success tangibly, you can’t evaluate initiatives. Quality metrics make execution metrics honest.
Decision velocity + data trust (the executive steering layer)
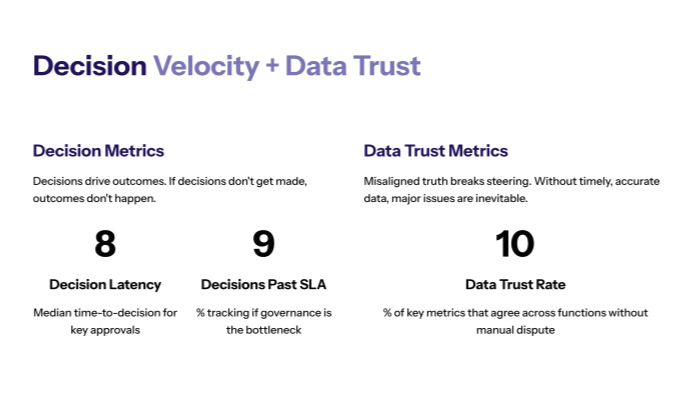
4.1 Decision metrics (because decisions drive outcomes)
RAPID is explicit: decision-making is central, decisions happen throughout, and if decisions don’t get made, outcomes don’t happen.
- Decision latency
Median time-to-decision for key approvals or exceptions.
- Decisions past SLA (%)
Tracks whether governance is becoming the bottleneck.
These two metrics alone can explain why execution “feels slow” even when teams are working hard.
4.2 Data trust metrics (because misaligned truth breaks steering)
RAPID warns that if you can’t get timely, accurate data and share it appropriately with decision makers, major issues are inevitable.
- Data reconciliation / trust rate
Percentage of key metrics that agree across functions (finance, ops, product) or percentage of reports produced without manual dispute.
If data trust is low, weekly metrics become arguments—not decisions.
How to run weekly metrics without creating reporting overhead?
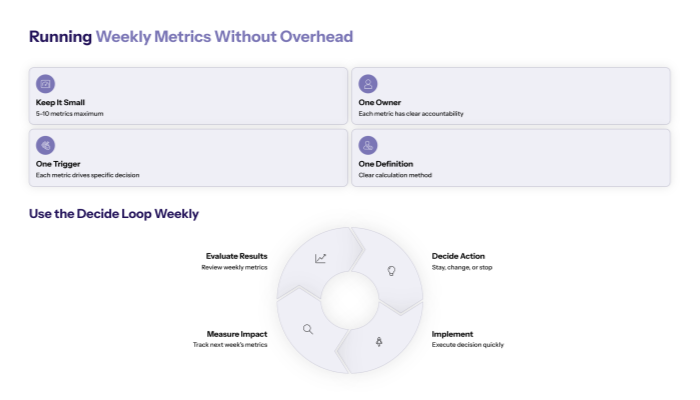
5.1 Keep the dashboard small: 5–10 metrics max
Weekly execution metrics must enable shipping, not create more work.
Rules:
- 5–10 metrics max
- one owner for each metric
- one decision trigger for each metric
- one definition-of-done for how the metric is calculated
RAPID emphasizes sorting relevant vs irrelevant information in Analyze—apply the same logic to measurement.
If the metric doesn’t help you decide, cut it.
5.2 Use the Decide loop weekly: stay / change / stop
RAPID’s Decide discipline is explicit: evaluate results, then decide to stay, change, or stop.
Weekly execution metrics exist to power that loop:
- If cycle time isn’t improving → re-check the constraint
- If rework rises → fix intake/acceptance criteria before scaling
- If decision latency spikes → redesign decision rights or escalation SLAs
- If data trust drops → stop expanding change until truth is aligned
That’s what transformation learning looks like in practice: fast, honest, and measurable.
Closing takeaway
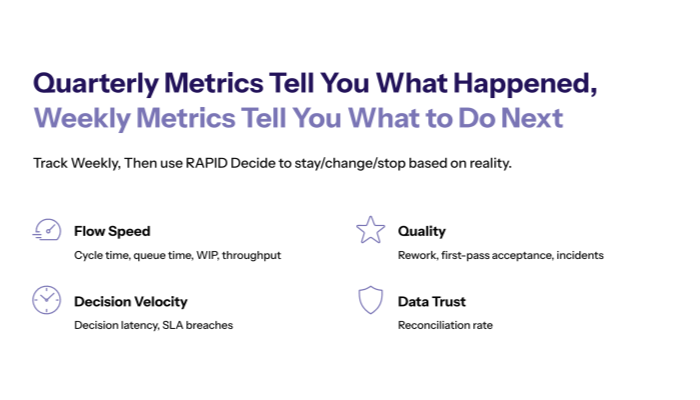
Quarterly metrics tell you what happened. Weekly execution metrics tell you what to do next.
Track weekly:
- flow speed (cycle time, queue time, WIP, throughput)
- quality (rework, first-pass acceptance, incidents)
- decision velocity (decision latency, SLA breaches)
- data trust (reconciliation rate)
Then use RAPID Decide to stay/change/stop based on reality.