KPI Design for Transformation: Leading vs Lagging Indicators
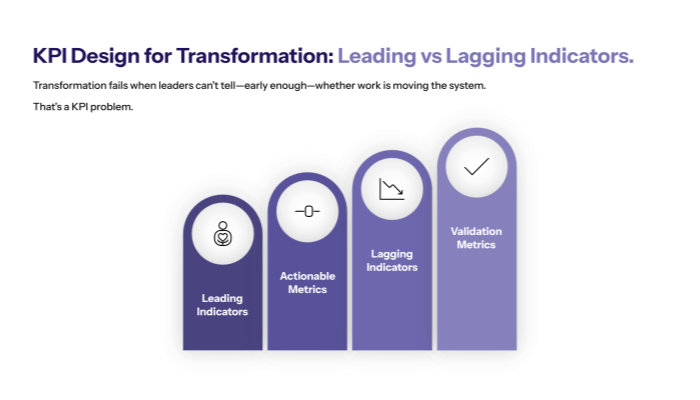
A transformation program doesn’t fail because teams don’t work hard. It fails because leaders can’t tell—early enough—whether the work is actually moving the system.
That’s a KPI problem.
In RAPID terms, if you can’t measure success in tangible ways, you can’t evaluate initiatives, and you’ll keep funding work that isn’t changing outcomes. Worse, the organization drifts into vanity metrics—numbers selectively chosen to feel good about decisions that may be wrong.
This post is a practical guide to KPI design for transformation, with a clear focus on leading vs lagging indicators—so your roadmap becomes measurable, your bottlenecks become visible, and your decisions stay grounded in reality.

Why KPI design for transformation usually goes wrong?
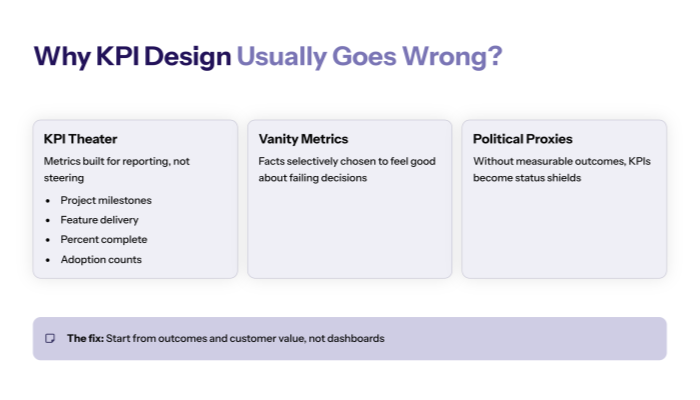
1.1 KPI theater happens when metrics protect a narrative
Most KPI systems fail because they’re built for reporting, not steering.
They track what’s easy:
- project milestones
- feature delivery
- “percent complete”
- adoption counts
- number of workshops / trainings
But transformation requires truth, not optics. RAPID explicitly warns about vanity metrics: facts selectively chosen to make leaders feel good about a decision that may be failing.
When KPI design for transformation starts from “what can we report?”, you end up measuring activity—then calling it progress.
1.2 Without measurable outcomes, KPI design becomes political
RAPID emphasizes that desired outcomes power everything, and that you must align actions around measurable outcomes rather than vague intent.
If outcomes aren’t ranked and explicit, KPIs become a proxy war:
- every team proposes metrics that make them look good
- dashboards become status shields
- bottlenecks remain untouched
The fix is simple but strict: KPI design for transformation must start from outcomes and customer value, not from dashboards.
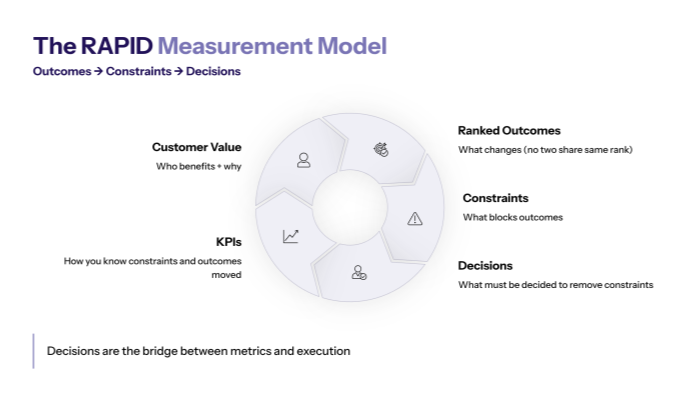
The RAPID measurement model (Outcomes → Constraints → Decisions)
2.1 Start from customer value and ranked outcomes
RAPID’s tool sequence forces you to define Customer Value first (including internal customers where relevant), then document and rank outcomes—no two outcomes share the same rank.
That ranking rule matters for KPI design for transformation because it prevents “everything is important” measurement sprawl.
A practical measurement chain:
- Customer value (who benefits + why)
- Ranked outcomes (what changes)
- Constraints (what blocks outcomes)
- Decisions (what must be decided to remove constraints)
- KPIs (how you know constraints and outcomes moved)
This keeps KPIs tied to steering the system—not describing it.
2.2 Decisions are the bridge between metrics and execution
RAPID treats decision-making as central: decisions happen throughout the work, and if critical decisions never get made, outcomes never happen.
That’s why KPI design for transformation should map directly to decision ownership using RAPID’s Decision Inventory (decisions posed as questions, assigned owners, linked to outcomes/customer value, prioritized).
If you can’t answer “What decision does this KPI support?”, it’s probably KPI theater.
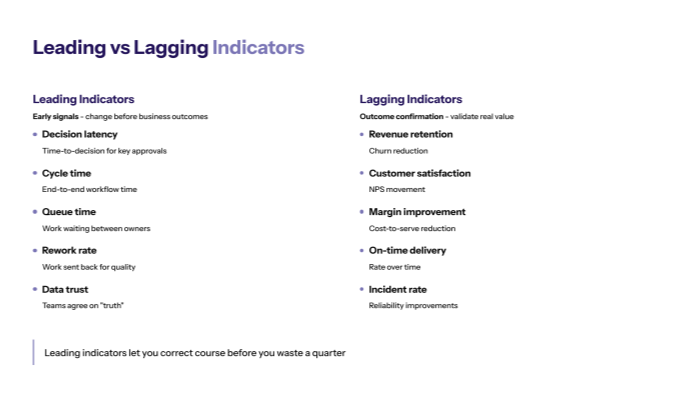
Leading vs lagging indicators (the definition that actually helps)
3.1 Leading indicators: constraint metrics that change first
Leading indicators are early signals. They change before the business outcome changes. In transformation, your best leading indicators are usually constraint metrics—signals that your operating model is getting faster, cleaner, and more reliable.
Examples of strong leading indicators for KPI design for transformation:
- Decision latency (time-to-decision for key approvals)
- Cycle time (end-to-end time through the workflow)
- Queue time at handoffs (time work waits between owners)
- Rework/return rate (work sent back due to missing info or quality)
- Data trust / reconciliation rate (teams agree on “truth”)
These metrics align with RAPID’s emphasis on focusing on what’s relevant, removing noise, and surfacing constraints beneath the surface.
Why leading indicators matter: they let you correct course before you waste a quarter.
3.2 Lagging indicators: business results that confirm impact
Lagging indicators are outcome confirmation. They move later, but they validate whether transformation created real value.
Examples of lagging indicators:
- revenue retention / churn
- customer satisfaction / NPS movement
- margin improvement / cost-to-serve reduction
- on-time delivery rate over time
- incident rate reductions (where reliability is the goal)
RAPID is explicit that success must be measurable and tangible, otherwise you can’t evaluate initiatives honestly. Lagging indicators are where you prove the transformation mattered.
Common mistake: teams track lagging indicators only—then realize too late they were steering blind.
A practical KPI design for transformation framework
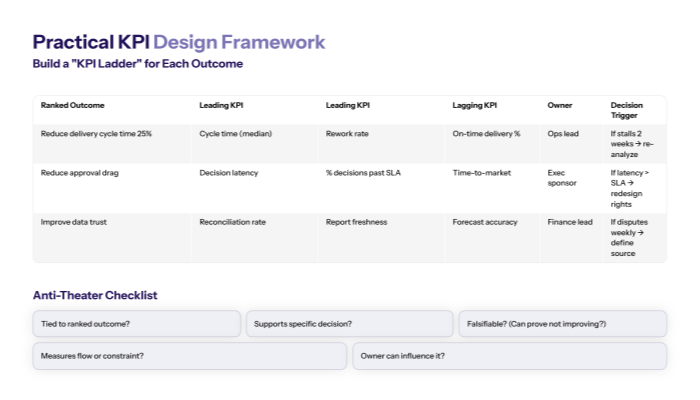
4.1 Build a “KPI ladder” for each outcome
For each ranked outcome, build a KPI ladder:
- 1–2 leading indicators (constraint metrics)
- 1 lagging indicator (business confirmation)
- an owner and decision trigger
Use this table:
|
Ranked outcome |
Leading KPI (constraint) |
Leading KPI (constraint) |
Lagging KPI (business) |
Owner |
Decision trigger |
|---|---|---|---|---|---|
|
Reduce delivery cycle time 25% |
Cycle time (median) |
Rework rate |
On-time delivery % |
Ops lead |
If cycle time stalls 2 weeks → re-analyze constraint |
|
Reduce approval drag |
Decision latency |
% decisions past SLA |
Time-to-market |
Exec sponsor |
If latency > SLA → redesign decision rights |
|
Improve data trust |
Reconciliation rate |
Report freshness |
Forecast accuracy |
Finance lead |
If disputes weekly → define source-of-truth |
This structure forces KPI design for transformation to remain tied to action.
4.2 Avoid vanity KPIs with a simple “anti-theater” checklist
Before a KPI goes on the dashboard, run it through this filter:
- Is it tied to a ranked outcome?
- Does it support a specific decision?
- Is it falsifiable? (Can it prove we’re not improving?)
- Does it measure flow or constraint movement?
- Can the owner influence it? (If not, it’s noise.)
If a KPI fails this checklist, it’s likely a vanity metric—exactly what RAPID warns against.
Extra guardrail: keep KPI design for transformation small. If you have 40 KPIs, you have zero.
Operating cadence: How to use KPIs to drive RAPID decisions?
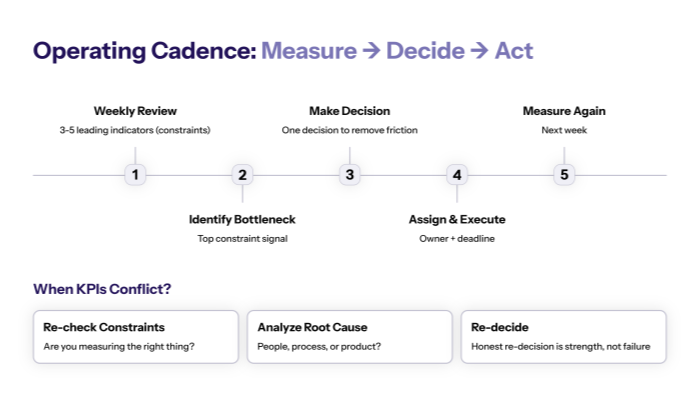
5.1 Weekly steering: measure → decide → act (not “review and admire”)
RAPID’s Decide discipline is simple: after action, evaluate results and decide to stay, change, or stop based on reality.
A KPI cadence that prevents theater:
- Review 3–5 leading indicators weekly (constraints)
- Identify the top bottleneck signal
- Make one decision to remove friction
- Assign owner + deadline
- Measure again next week
This matches RAPID’s flywheel approach: better information → better analysis → better planning → better decisions.
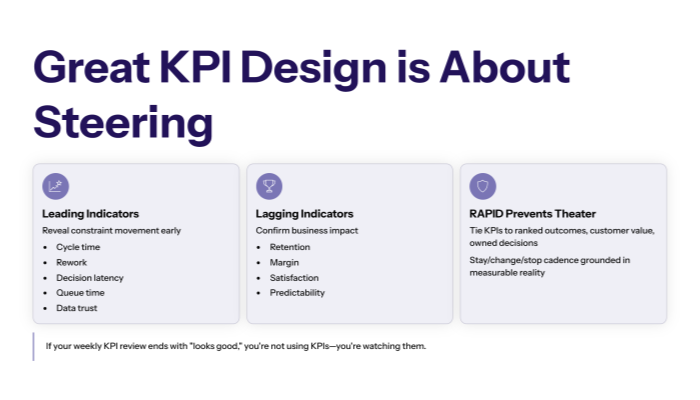
If your weekly KPI review ends with “looks good,” you’re not using KPIs—you’re watching them.
5.2 What to do when KPIs conflict? (and they will)
In real KPI design for transformation, signals conflict:
- cycle time improves but quality drops (rework rises)
- decision latency drops but customer satisfaction doesn’t move yet
- data freshness improves but reconciliation is still weak
RAPID’s response is not to argue longer. It’s to re-check:
- whether you’re measuring the right constraint
- whether the root cause is people/process/product
- whether you need to go back to Research/Analyze because you’re missing what’s beneath the surface
Then you re-decide. RAPID treats honest re-decision as a strength, not a failure.
Closing takeaway
Great KPI design for transformation is not about reporting. It’s about steering.
- Leading indicators reveal constraint movement early (cycle time, rework, decision latency, queue time, data trust).
- Lagging indicators confirm business impact later (retention, margin, satisfaction, predictability).
- RAPID prevents KPI theater by tying KPIs to ranked outcomes, customer value, owned decisions, and a stay/change/stop cadence grounded in measurable reality.