KPI Theater: How Misleading Metrics Hide the Real Bottleneck
If your transformation feels “busy” but outcomes aren’t changing, there’s a good chance you’re stuck in KPI theater.
KPI theater happens when metrics are used to create confidence, not clarity—when dashboards look healthy while the real constraint stays untouched. Teams report activity, leaders hear progress, and the organization keeps moving… in the wrong direction.
RAPID calls this out directly through its warning about vanity metrics: measurements selectively chosen to make you feel good about a decision that is actually wrong. And it emphasizes that unless you can measure success in tangible ways, you can’t meaningfully evaluate initiatives—so failure keeps getting funded.
This post breaks down what KPI theater looks like, why it’s dangerous, and how RAPID replaces it with decision-grade measurement that reveals the real bottleneck.

What KPI theater is and why it spreads in transformation programs?
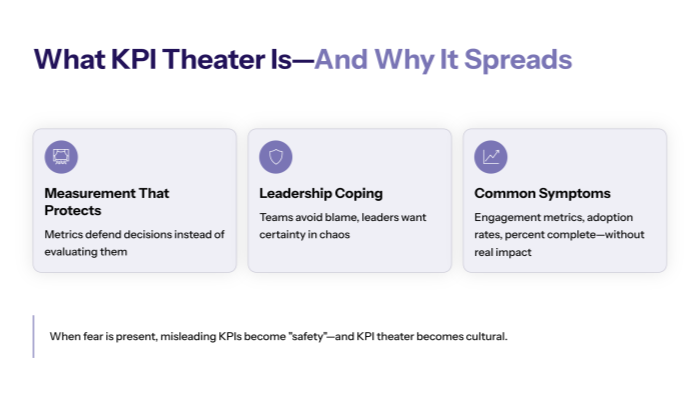
1.1 KPI theater is “measurement that protects a narrative”
The fastest way to define KPI theater:
Metrics that help you defend a decision instead of evaluate it.
In a transformation, this usually shows up as:
- “engagement” metrics that don’t affect outcomes
- adoption metrics without behavior change
- project milestones without business impact
- “percent complete” reporting
RAPID’s critique of vanity metrics matters here: when you cherry-pick facts to feel good about a decision, you lose the ability to tell the truth about whether the initiative is working.
1.2 KPI theater is a leadership coping mechanism
KPI theater isn’t always malicious. It’s often a coping mechanism for uncertainty:
- leaders want certainty in chaos
- teams want to avoid blame
- nobody wants to admit the strategy needs to change
RAPID addresses this indirectly through its focus on honest assessment and the elimination of fear and doubt by aligning actions around specific measurable outcomes, not comfortable narratives.
When fear is present, misleading KPIs become “safety.” And that’s how KPI theater becomes cultural.
Why misleading metrics hide the real bottleneck?
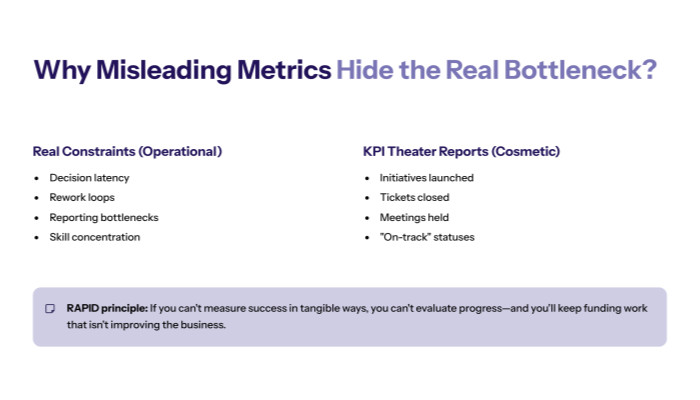
2.1 The bottleneck is usually operational, but KPIs are usually cosmetic
Most real constraints live in execution:
- decision latency (approvals)
- rework loops (quality and handoffs)
- reporting bottlenecks (data trust)
- skill concentration (throughput gate)
But KPI theater tends to report:
- number of initiatives launched
- number of tickets closed
- number of meetings held
- “on-track” statuses
RAPID’s Analyze guidance is relevant here: you must sort relevant vs irrelevant information and eliminate what wastes time. KPI theater is irrelevant information masquerading as control.
2.2 When you can’t measure outcome impact, you can’t manage risk
RAPID is explicit: if you can’t measure the success of initiatives in tangible ways, you can’t evaluate progress, and you’ll keep funding work that isn’t improving the business.
KPI theater increases transformation risk because it hides failure modes early:
- declining trust
- rising cycle time
- increasing rework
- escalating decision latency
And those are exactly the signals that tell you where the real bottleneck is.
Section 3: How RAPID prevents KPI theater? Outcomes, decisions, and truth
3.1 Tie metrics to outcomes and customer value (or don’t track them)
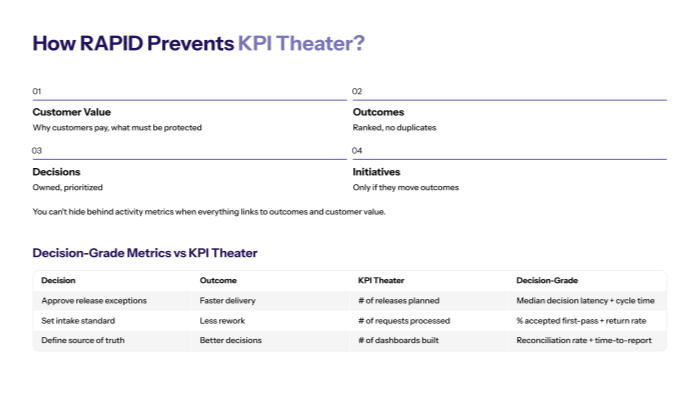
RAPID’s structure forces a hierarchy:
- customer value (why customers pay / what must be protected)
- outcomes (ranked, no duplicates)
- decisions (owned, prioritized)
- initiatives (only if they move outcomes)
This is why KPI theater collapses under RAPID: you can’t hide behind activity metrics when everything is linked to outcomes and customer value.
RAPID also emphasizes that decisions are central and create momentum—if a decision doesn’t happen, the outcome doesn’t happen.
So you don’t measure “progress” with milestones. You measure:
- did we make the right decisions on time?
- did cycle time improve?
- did rework decrease?
- did the bottleneck move?
3.2 Use Decision Inventory to force “decision-grade metrics”
RAPID’s Decision Inventory makes KPI theater harder by forcing specificity: decisions are posed as questions, assigned owners, linked to outcomes and customer value, and prioritized.
This naturally produces decision-grade measurement:
- What metric tells us whether this decision is working?
- What is the minimum viable measurement?
- What is the expected change window?
Example mapping:
|
Decision |
Outcome |
KPI theater metric (bad) |
Decision-grade metric (good) |
|---|---|---|---|
|
“Who can approve release exceptions?” |
Faster delivery |
“# of releases planned” |
median decision latency + release cycle time |
|
“What is the intake standard?” |
Less rework |
“# of requests processed” |
% accepted first-pass + return rate |
|
“Which report is source of truth?” |
Better decisions |
“# of dashboards built” |
reconciliation rate + time-to-report |
Replace KPI theater with a constraint dashboard (simple + honest)
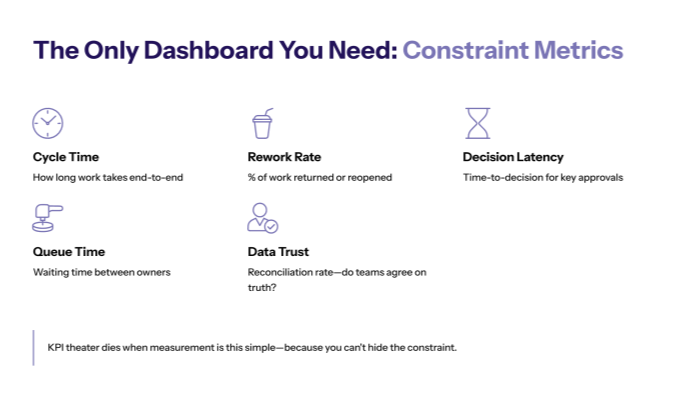
4.1 The only dashboard you need: constraint metrics
If you want to reveal the real bottleneck, measure the system where it breaks.
A practical RAPID-aligned “constraint dashboard” uses 3–5 metrics max:
- Cycle time: how long work takes end-to-end
- Rework rate: % of work returned/reopened
- Decision latency: time-to-decision for key approvals
- Queue time at handoffs: waiting time between owners
- Data trust / reconciliation rate: whether teams agree on “truth”
RAPID’s Analyze phase encourages removing irrelevant metrics and focusing on what pinpoints problems and drives execution.
KPI theater dies when measurement is this simple—because you can’t hide the constraint.
4.2 Use gap analysis to tie metrics to fixes
RAPID gap analyses convert findings into executable improvements aligned to outcomes and customer value:
- People Gap Analysis
- Process Gap Analysis
- Product Gap Analysis
This is the missing step in most KPI systems:
- they measure activity
- they don’t connect measurement to a specific fix
- they don’t assign an owner
With gap analysis, every metric has a “next move.”
Sustain truth (stay/change/stop) and keep the flywheel moving
5.1 Decide based on results, not slide decks
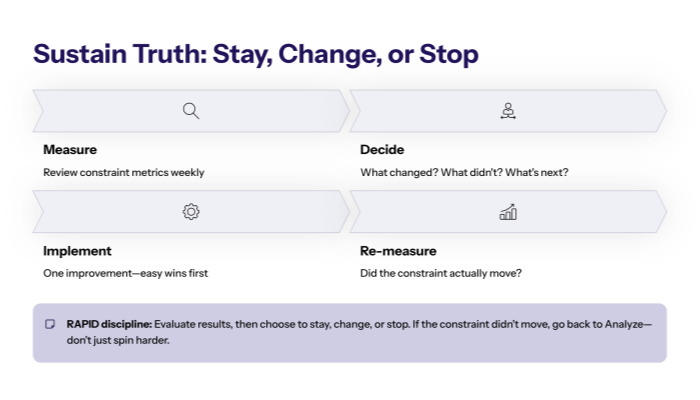
RAPID’s Decide logic is a necessary antidote to KPI theater: evaluate results and then choose to stay, change, or stop.
KPI theater thrives when decisions are defended regardless of outcomes. RAPID makes “re-deciding” part of the operating system.
This is also where the warning about vanity metrics is most important: if leadership uses metrics to protect ego, the organization loses its ability to self-correct.
5.2 Use the flywheel discipline: measure → decide → adapt
RAPID is built as iterative flywheels: Research/Analyze feeds Plan/Implement/Decide, and results feed back into better research and better analysis.
That’s how you keep measurement honest:
- weekly: review constraint metrics
- decide: what changed, what didn’t, what to do next
- implement: one improvement (preferably easy wins first)
- re-measure: did the constraint actually move?
If it didn’t, you don’t “spin harder.” You go back to Analyze and find what you missed.
Closing takeaway
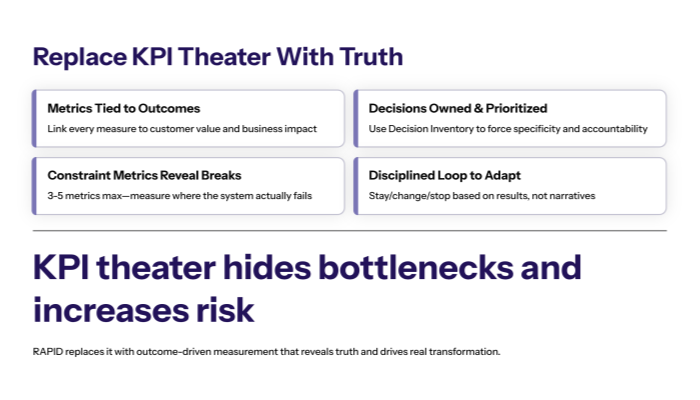
KPI theater doesn’t just waste time—it hides the real bottleneck and increases transformation risk.
RAPID replaces KPI theater with an outcome-driven measurement system:
- metrics tied to outcomes and customer value
- decisions owned and prioritized
- constraint metrics that reveal where the system breaks
- a disciplined loop to stay/change/stop based on results