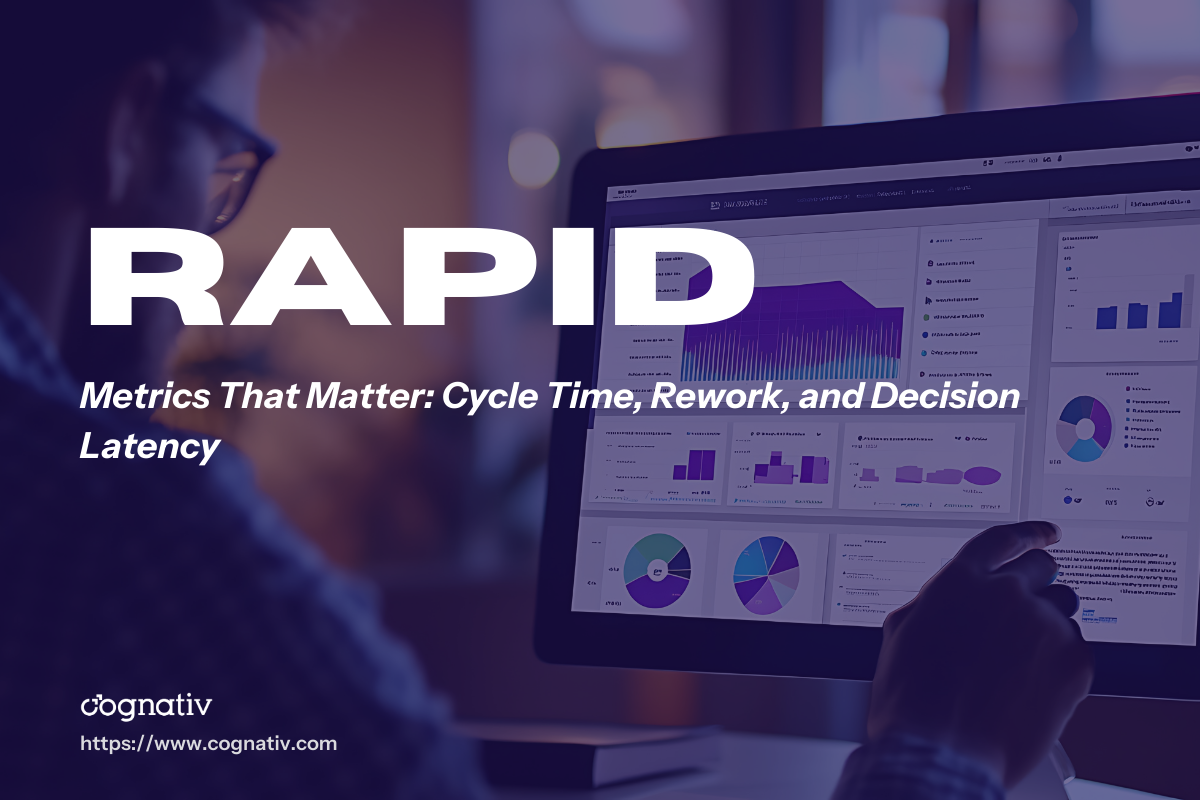
Metrics That Matter: Cycle Time, Rework, and Decision Latency
If you want digital transformation to produce real outcomes, you need metrics that matter—the few measures that tell you whether the system is getting faster, cleaner, and easier to run. RAPID is explicit that transformation should align actions around specific measurable outcomes rather than vanity metrics that “look good” but don’t improve strategy.
This is why cycle time, rework, and decision latency are so powerful: they are operating-model metrics. They don’t just describe performance; they explain why performance is what it is—and what to fix first.
Below is a practical guide to using these metrics that matter inside a RAPID-style transformation: how to define them, how to measure them quickly, and how to turn them into an execution cadence that drives decisions instead of dashboards.

Why “Metrics That Matter” Beat Vanity Metrics Every Time?
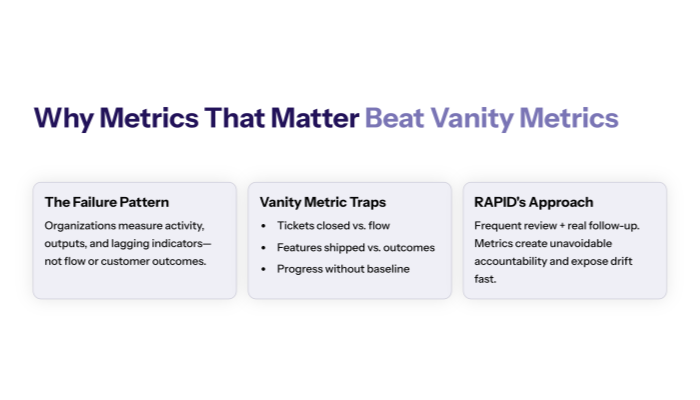
1.1 The transformation failure pattern: “we measured the wrong thing”
Most organizations don’t lack data. They lack decision-grade truth.
In RAPID, the goal is to reduce fear and doubt by aligning work to measurable outcomes—not “metrics that make you look good to others.” Vanity metrics are selectively chosen numbers that protect a narrative after reality has changed. RAPID warns that relying on them is how leaders fool themselves and keep driving down a dead-end road.
Common vanity-metric traps in digital transformation:
- Measuring activity (tickets closed, features shipped) instead of flow.
- Measuring outputs (deployments, utilization) instead of customer outcomes.
- Measuring lagging indicators only (revenue, churn) with no system levers.
- Measuring “progress” without a baseline, so every report is just a story.
Metrics that matter behave differently: they are hard to game, close to the work, and directly tied to what teams experience every day.
1.2 RAPID’s lens: measurable outcomes + frequent review + real follow-up
RAPID treats measurement as a feedback loop. Progress should be reviewed as often as possible, and that review should feed back into the earlier stages (results and reconnaissance). RAPID even calls out a common organizational weakness: decisions get made, then there’s not enough follow-up to see if the initiative worked.
That’s the real purpose of metrics that matter:
- They make follow-up unavoidable.
- They force decisions based on reality.
- They create momentum by showing improvement (or exposing drift fast).
Cycle Time — The Fastest Truth About Your System
2.1 What cycle time is (and why it’s the #1 flow metric)
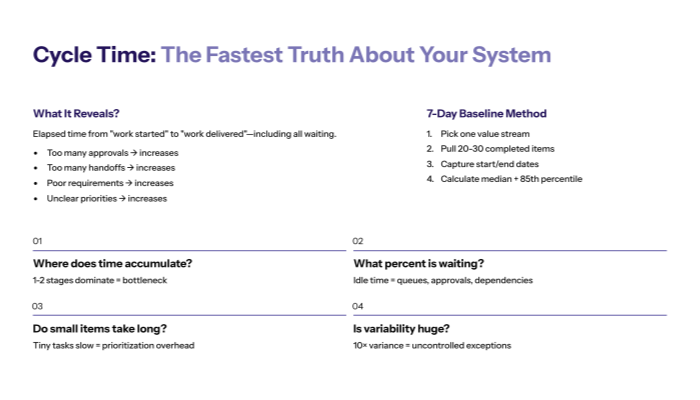
Cycle time is the elapsed time from “work started” to “work delivered,” measured end-to-end. It includes waiting.
Cycle time is one of the core metrics that matter because it compresses multiple dysfunctions into one number:
- Too many approvals → cycle time increases
- Too many handoffs → cycle time increases
- Poor requirements → cycle time increases (because rework increases)
- Unclear priorities → cycle time increases (because work thrashes)
How to define cycle time (choose one):
- Request-to-value: from intake to customer value realized (best for exec visibility)
- Commit-to-done: from when work is accepted into execution to completion (best for delivery teams)
- Stage-to-stage: cycle time per stage (best for bottleneck hunting)
RAPID alignment: Research + Analyze explore internal metrics and evaluate them, then Plan/Implement/Decide uses that feedback to iterate. Cycle time is the simplest “system pulse” to start that loop.
2.2 How to measure cycle time in 7 days (without perfect data)
You do not need instrumented perfection to start. You need a baseline you can trust.
7-day cycle-time baseline method
- Pick one value stream (onboarding, incident resolution, quote-to-cash, feature delivery).
- Pull a small sample: 20–30 completed work items from the last 30–60 days.
- For each item, capture:
- Start date/time (when work truly began)
- End date/time (when value was delivered or accepted)
- “Waiting points” (approval, dependency, handoff)
- Calculate:
- Median cycle time (your “typical” reality)
- 85th percentile cycle time (your pain tail)
What to do with it immediately
- Don’t debate the number for two weeks.
- Use it to identify where waiting concentrates.
- Choose one constraint to attack (RAPID: “cut to the chase” through quick measurement and adjustment).
Cycle time quick audit
Question |
What you’re looking for |
What it usually means |
|---|---|---|
Where does time accumulate? |
1–2 stages dominate total time |
Bottleneck or decision drag |
What percent is “waiting”? |
Work is idle more than active |
Queues, approvals, dependencies |
Do small items also take long? |
Tiny tasks still slow |
Prioritization + handoff overhead |
Is variability huge? |
Some items take 10× longer |
Uncontrolled exceptions + rework |
Cycle time is the most executive-friendly of the metrics that matter because it translates instantly into customer experience: speed, responsiveness, predictability.
Rework — The Hidden Tax That Makes Everything Feel Hard
3.1 What rework is and why it destroys transformation ROI
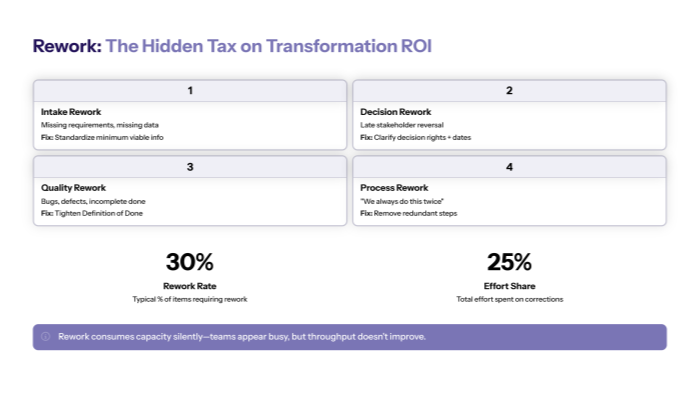
Rework is work that must be redone, corrected, reopened, or returned because the system failed to produce a clean outcome the first time.
Rework is one of the most brutal metrics that matter because it consumes capacity silently:
- Teams appear “busy,” but throughput doesn’t improve.
- Lead times increase even when headcount increases.
- Quality conversations become emotional (because nobody sees the system mechanics).
Common sources of rework:
- Incomplete intake (missing inputs)
- Ambiguous definitions of “done”
- Conflicting stakeholder expectations
- Late-stage approvals that invalidate work
- Poor data quality or inconsistent definitions
RAPID’s emphasis on clear, accurate communication and brutal self-awareness is a direct antidote to rework—because rework is often the cost of unclear reality and unclear outcomes.
3.2 How to measure rework without complex tooling?
You can measure rework with simple signals:
Operational rework signals
- Ticket “reopens” (support/engineering)
- Work item sent “back” a stage (approval returned, QA failed)
- Change requests after sign-off
- Duplicate work (two teams solving the same problem)
- Manual corrections due to data issues
Start with two rework metrics
- Rework rate: % of items that required rework
- Rework effort share: % of total effort spent on rework (estimate first, instrument later)
Rework classification (simple + useful)
Rework type |
Example |
Fix lever |
|---|---|---|
Intake rework |
Missing requirements, missing data |
Standardize intake “minimum viable info” |
Decision rework |
Late stakeholder reversal |
Clarify decision rights + decision dates |
Quality rework |
Bugs, defects, incomplete done |
Tighten Definition of Done + testing gates |
Process rework |
“We always do this twice” |
Remove redundant steps + automate checks |
Once rework becomes visible, it becomes actionable. And metrics that matter are supposed to do exactly that: reveal where friction lives so you can remove it.
Decision Latency — The Bottleneck Nobody Admits Is a Bottleneck
4.1 Why decision latency is the real “speed limit” of transformation
RAPID treats decision-making as the hardest and most important management task—and formalizes it through a Decision Inventory to identify which decisions drive outcomes. RAPID also highlights that decisions are essential to keep momentum going; if a single critical decision never gets made, the outcome never happens.
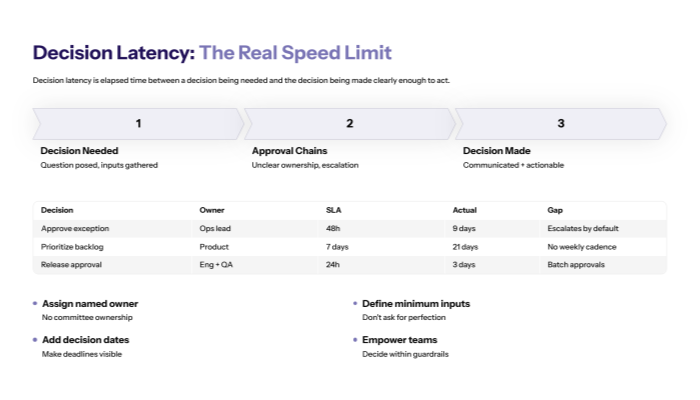
Decision latency is the elapsed time between:
- a decision being needed and
- the decision being made (and communicated clearly enough to act)
Decision latency becomes the hidden transformation killer when:
- approval chains are unclear
- decisions escalate unnecessarily
- leaders micromanage implementation instead of empowering teams
- nobody has a deadline, so decisions drift
RAPID is blunt about empowerment: once leadership backs the strategy, teams should be empowered to make implementation decisions, because decisions must be made close to the ground where knowledge exists.
That’s why decision latency belongs in your top set of metrics that matter—it’s the operational proof of whether your operating model is truly executable.
4.2 How to measure decision latency (and reduce it fast)
You don’t need to measure every decision. Measure the ones that repeatedly block flow.
Start with the “Top 10 decisions” inventory
Use RAPID’s decision-inventory framing: decisions are typically posed as questions, aligned to outcomes, and prioritized.
For each decision, capture:
- Decision question (e.g., “Do we approve exception X?”)
- Owner (who decides)
- Inputs needed (what evidence is required)
- SLA (how fast it must be made)
- Actual latency (how long it took last 5 times)
Decision latency table (drop-in template)
Decision |
Owner |
Inputs |
SLA |
Actual (median) |
Notes |
|---|---|---|---|---|---|
Approve exception |
Ops lead |
Risk + impact |
48h |
9 days |
Escalates by default |
Prioritize backlog |
Product |
Outcome metrics |
7 days |
21 days |
No weekly cadence |
Release approval |
Eng + QA |
Defect risk |
24h |
3 days |
Batch approvals |
Reduction moves (usually immediate)
- Assign a named owner (no “committee ownership”)
- Define minimum viable inputs (don’t ask for perfection)
- Add decision dates (RAPID even notes adding a decision date column when visible).
- Empower teams to decide within guardrails (leadership “decides to no longer decide” on implementation minutiae).
Decision latency is where transformation either becomes momentum—or becomes theater. That’s why it’s one of the core metrics that matter.
Turn These Metrics Into an Operating System (RAPID Cadence)
5.1 The “three metrics” weekly checkpoint
RAPID is designed to be fluid: you plan, implement, and then decide whether what you put into action is actually improving what you wanted to improve—and you iterate based on feedback.
To make that real, you need a cadence where metrics that matter drive decisions.
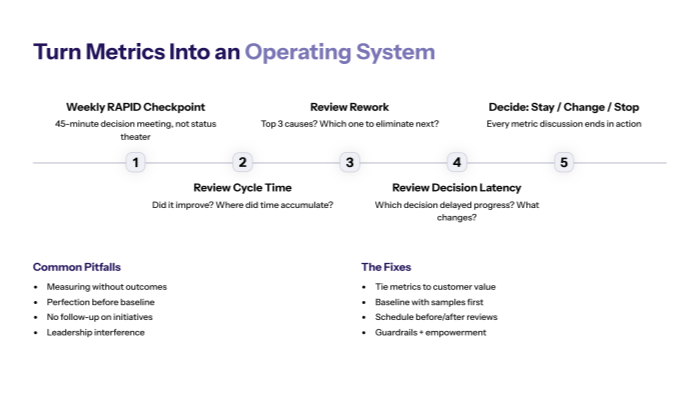
Weekly RAPID checkpoint (45 minutes)
- Cycle time: Did it improve, worsen, or stay flat? Where did time accumulate?
- Rework: What were the top 3 rework causes? Which one will we eliminate next?
- Decision latency: Which decision delayed progress most? What will we change in decision rights/SLA?
Rules
- No “status theater.” This is a decision meeting.
- Every metric discussion ends in one action: stay / change / stop (RAPID’s Decide framing).
- If you can’t decide, your decision system is the bottleneck.
5.2 Common pitfalls (and how to avoid them)
Even teams with the right metrics fail when they treat metrics as reporting instead of steering.
Pitfall 1: Measuring without outcomes
RAPID starts with outcomes aligned to customer value, because measurement without outcomes becomes noise.
Fix: tie cycle time/rework/decision latency to one outcome goal and one customer value.
Pitfall 2: Perfection before baseline
RAPID emphasizes quick, incremental testing, measurement, and adjustment—don’t freeze waiting for perfect instrumentation.
Fix: baseline with a sample set, then improve data quality over time.
Pitfall 3: No follow-up
RAPID explicitly asks whether your business measures initiative success tangibly or just moves on.
Fix: every initiative must have “before/after” metrics and a review date.
Pitfall 4: Leadership interference
If management interferes too much, decision-making shifts away from where work happens, and latency grows. RAPID argues for empowering implementation teams and leadership staying out of the way once strategy is set.
Fix: guardrails + empowerment + explicit decision rights.
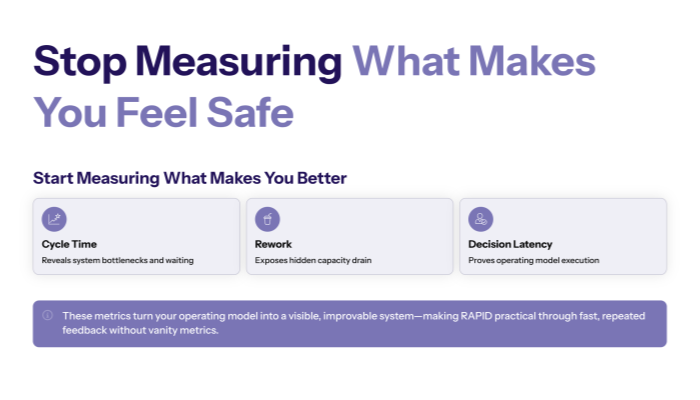
Final takeaway
If you’re serious about digital transformation, stop measuring what makes you feel safe and start measuring what makes you better. Metrics that matter—cycle time, rework, and decision latency—turn your operating model into a visible, improvable system.
They also make RAPID practical: you assess truth, define outcomes, measure what changes, and decide what to do next based on feedback—fast, repeatedly, and without relying on vanity metrics.