Leading and Lagging Indicators: Definitions, Analysis, and Strategic Application
In today's data-driven business landscape, understanding and effectively utilizing leading and lagging indicators is paramount for executives seeking to optimize performance and drive sustainable growth.
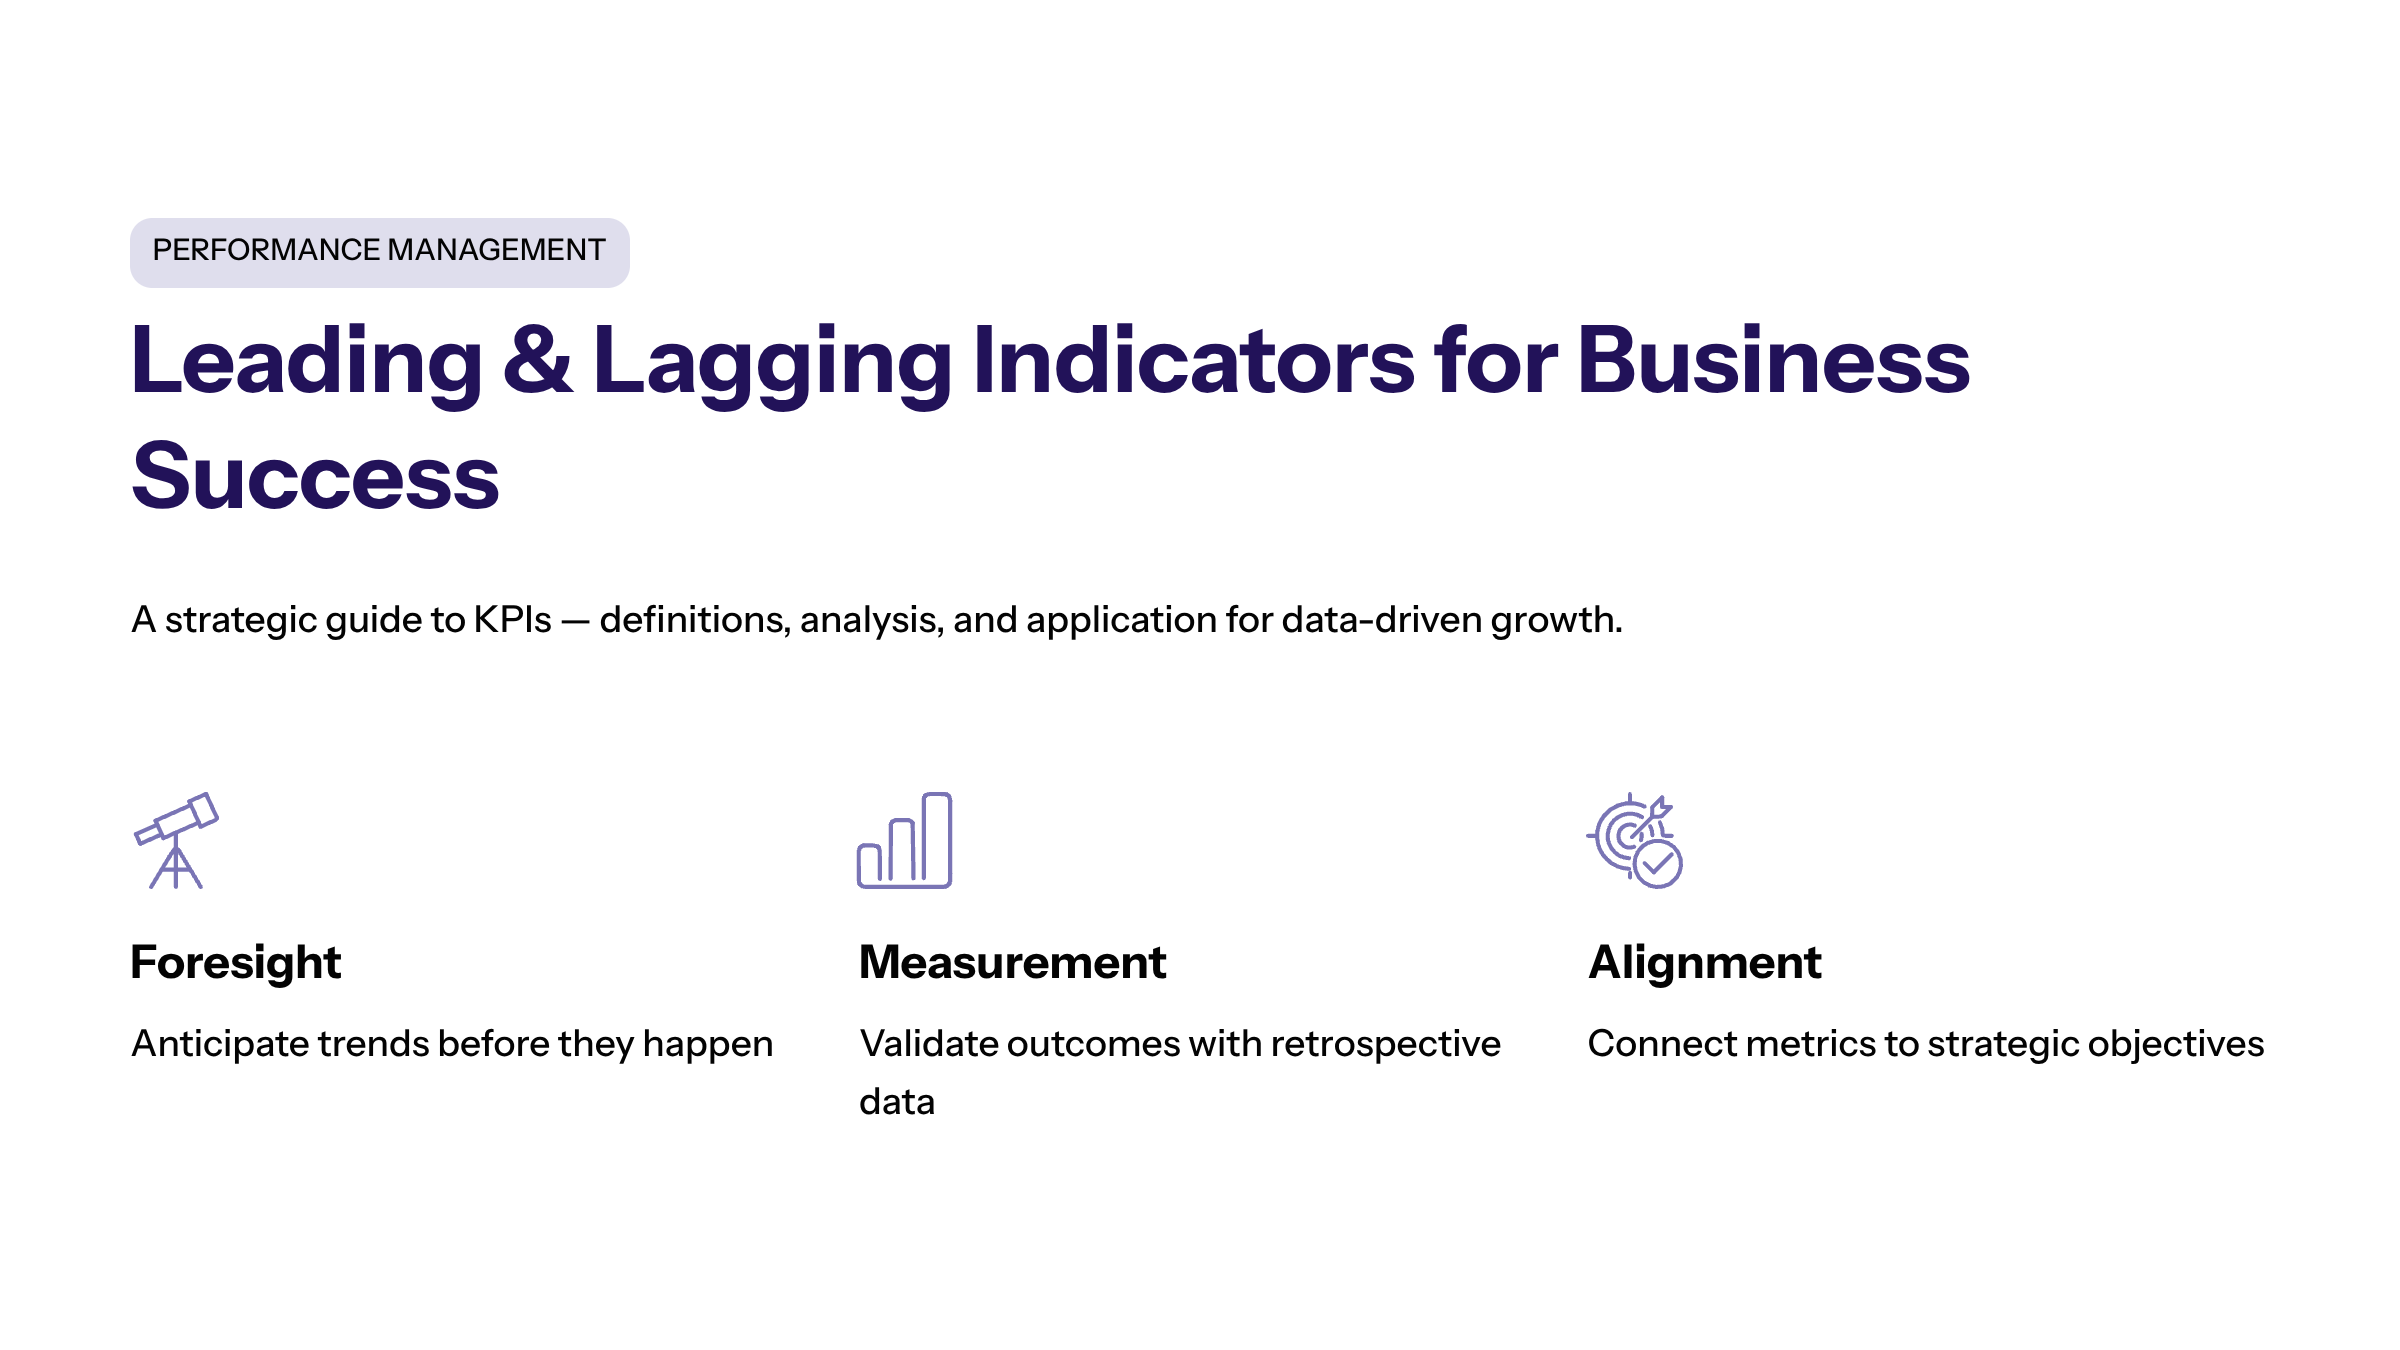
This article offers a comprehensive exploration of leading and lagging key performance indicators (KPIs), their strategic relevance, and practical applications across various organizational functions.
By integrating these metrics within a cohesive performance management framework, businesses can gain valuable insights, anticipate future trends, and make data-driven decisions that align with their strategic objectives.
Key Takeaways
Leading indicators are predictive, forward-looking metrics that provide early warning signs and actionable insights to influence future business outcomes proactively. Their predictive power signals trends or potential problems before they significantly impact the bottom line.
Lagging indicators reflect past performance, offering accountability and a factual basis for evaluating the effectiveness of strategies and achieving business goals. They can create a culture of accountability by allowing organizations to hold teams responsible for past performance.
A balanced approach that combines leading and lagging KPIs enables organizations to monitor progress comprehensively, optimize resource allocation, and foster a culture of continuous improvement.
Understanding Leading Indicators: What They Are and When to Use Them
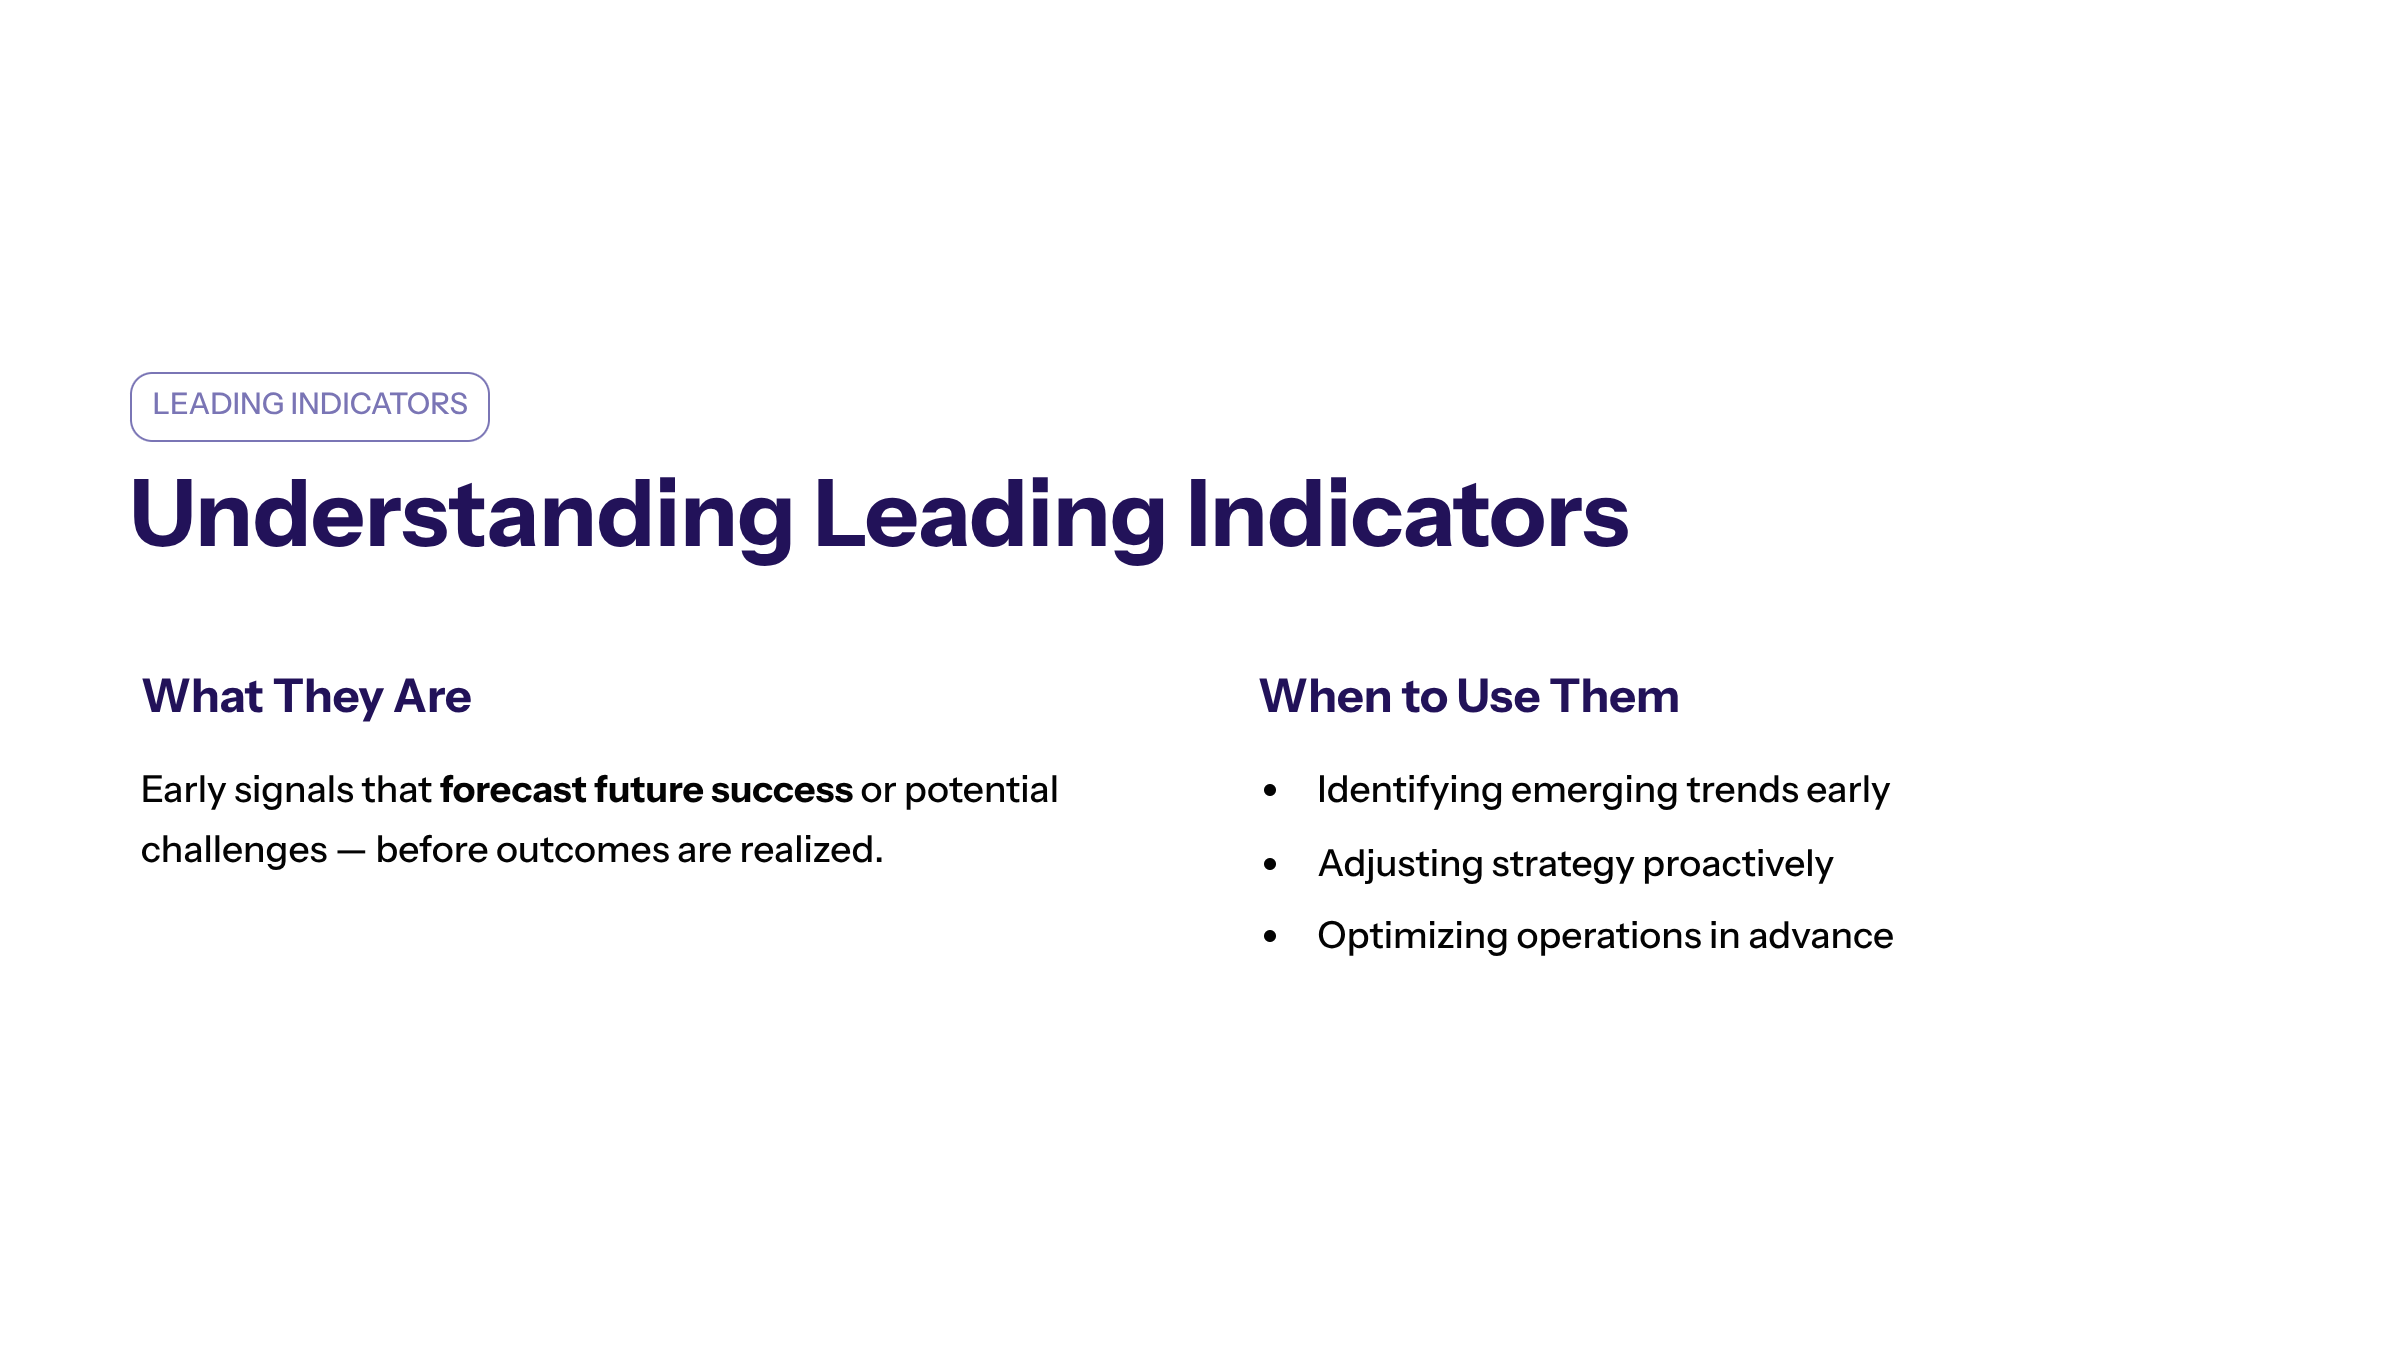
Leading indicators serve as early signals that forecast future success or potential challenges within a business. These forward-looking metrics are critical for executives aiming to identify trends, adjust strategies, and optimize operations before outcomes are realized.
When Should You Use Leading Indicators?
Leading indicators are particularly valuable during strategic planning, marketing campaigns, sales initiatives, and operational monitoring. For example, a sales team might track the number of qualified leads or the average sales cycle length as leading KPIs to predict future revenue growth. Similarly, a customer success team can monitor early product adoption rates or customer engagement metrics to anticipate customer retention and lifetime value.
Key Benefits of Leading Indicators
Enabling Proactive Decision-Making
Leading KPIs empower organizations to act on early warning signs, allowing for adjustments in marketing strategy, sales outreach efforts, or operational processes to steer toward desired outcomes.
Gaining Competitive Advantage
Companies that monitor relevant leading indicators—such as website engagement or customer acquisition cost—can anticipate market shifts and customer needs, positioning themselves ahead of competitors.
Enhancing Operational Efficiency
By focusing on specific metrics that drive future success, businesses can allocate resources strategically, optimize the sales process, and improve overall profitability. Effective leading KPIs vary by department and focus on the "little wins" that eventually add up to high-level goals.
Boosting Stakeholder Confidence
Real-time visibility into progress against strategic goals fosters transparency and alignment among stakeholders, reinforcing confidence in the organization's direction.
Challenges Associated with Leading Indicators
Risk of False Positives
Leading indicators can sometimes generate misleading signals, prompting premature or unnecessary interventions if not validated carefully.
Limited Historical Data for Validation
Due to their predictive nature, leading KPIs often lack extensive historical datasets, complicating efforts to assess their reliability and accuracy.
Complexity in Interpretation
Certain leading metrics require specialized analytical expertise to interpret correctly, underscoring the need for data-driven decision-making frameworks and skilled teams.
Common Examples of Leading Indicators
Indicator Type | Examples | Business Function |
|---|---|---|
Sales | Number of new leads, sales pipeline volume | Sales team |
Marketing | Website traffic, email open and click-through rates | Marketing strategy |
Customer Success | Product adoption rates, customer engagement scores | Customer success team |
Operations | Production cycle time, inventory turnover | Operations management |
"Leading indicators provide the necessary foresight for businesses to pivot and adapt in dynamic markets, making them indispensable for strategic agility." — Gartner Research

Exploring Lagging Indicators: Definition and Appropriate Usage
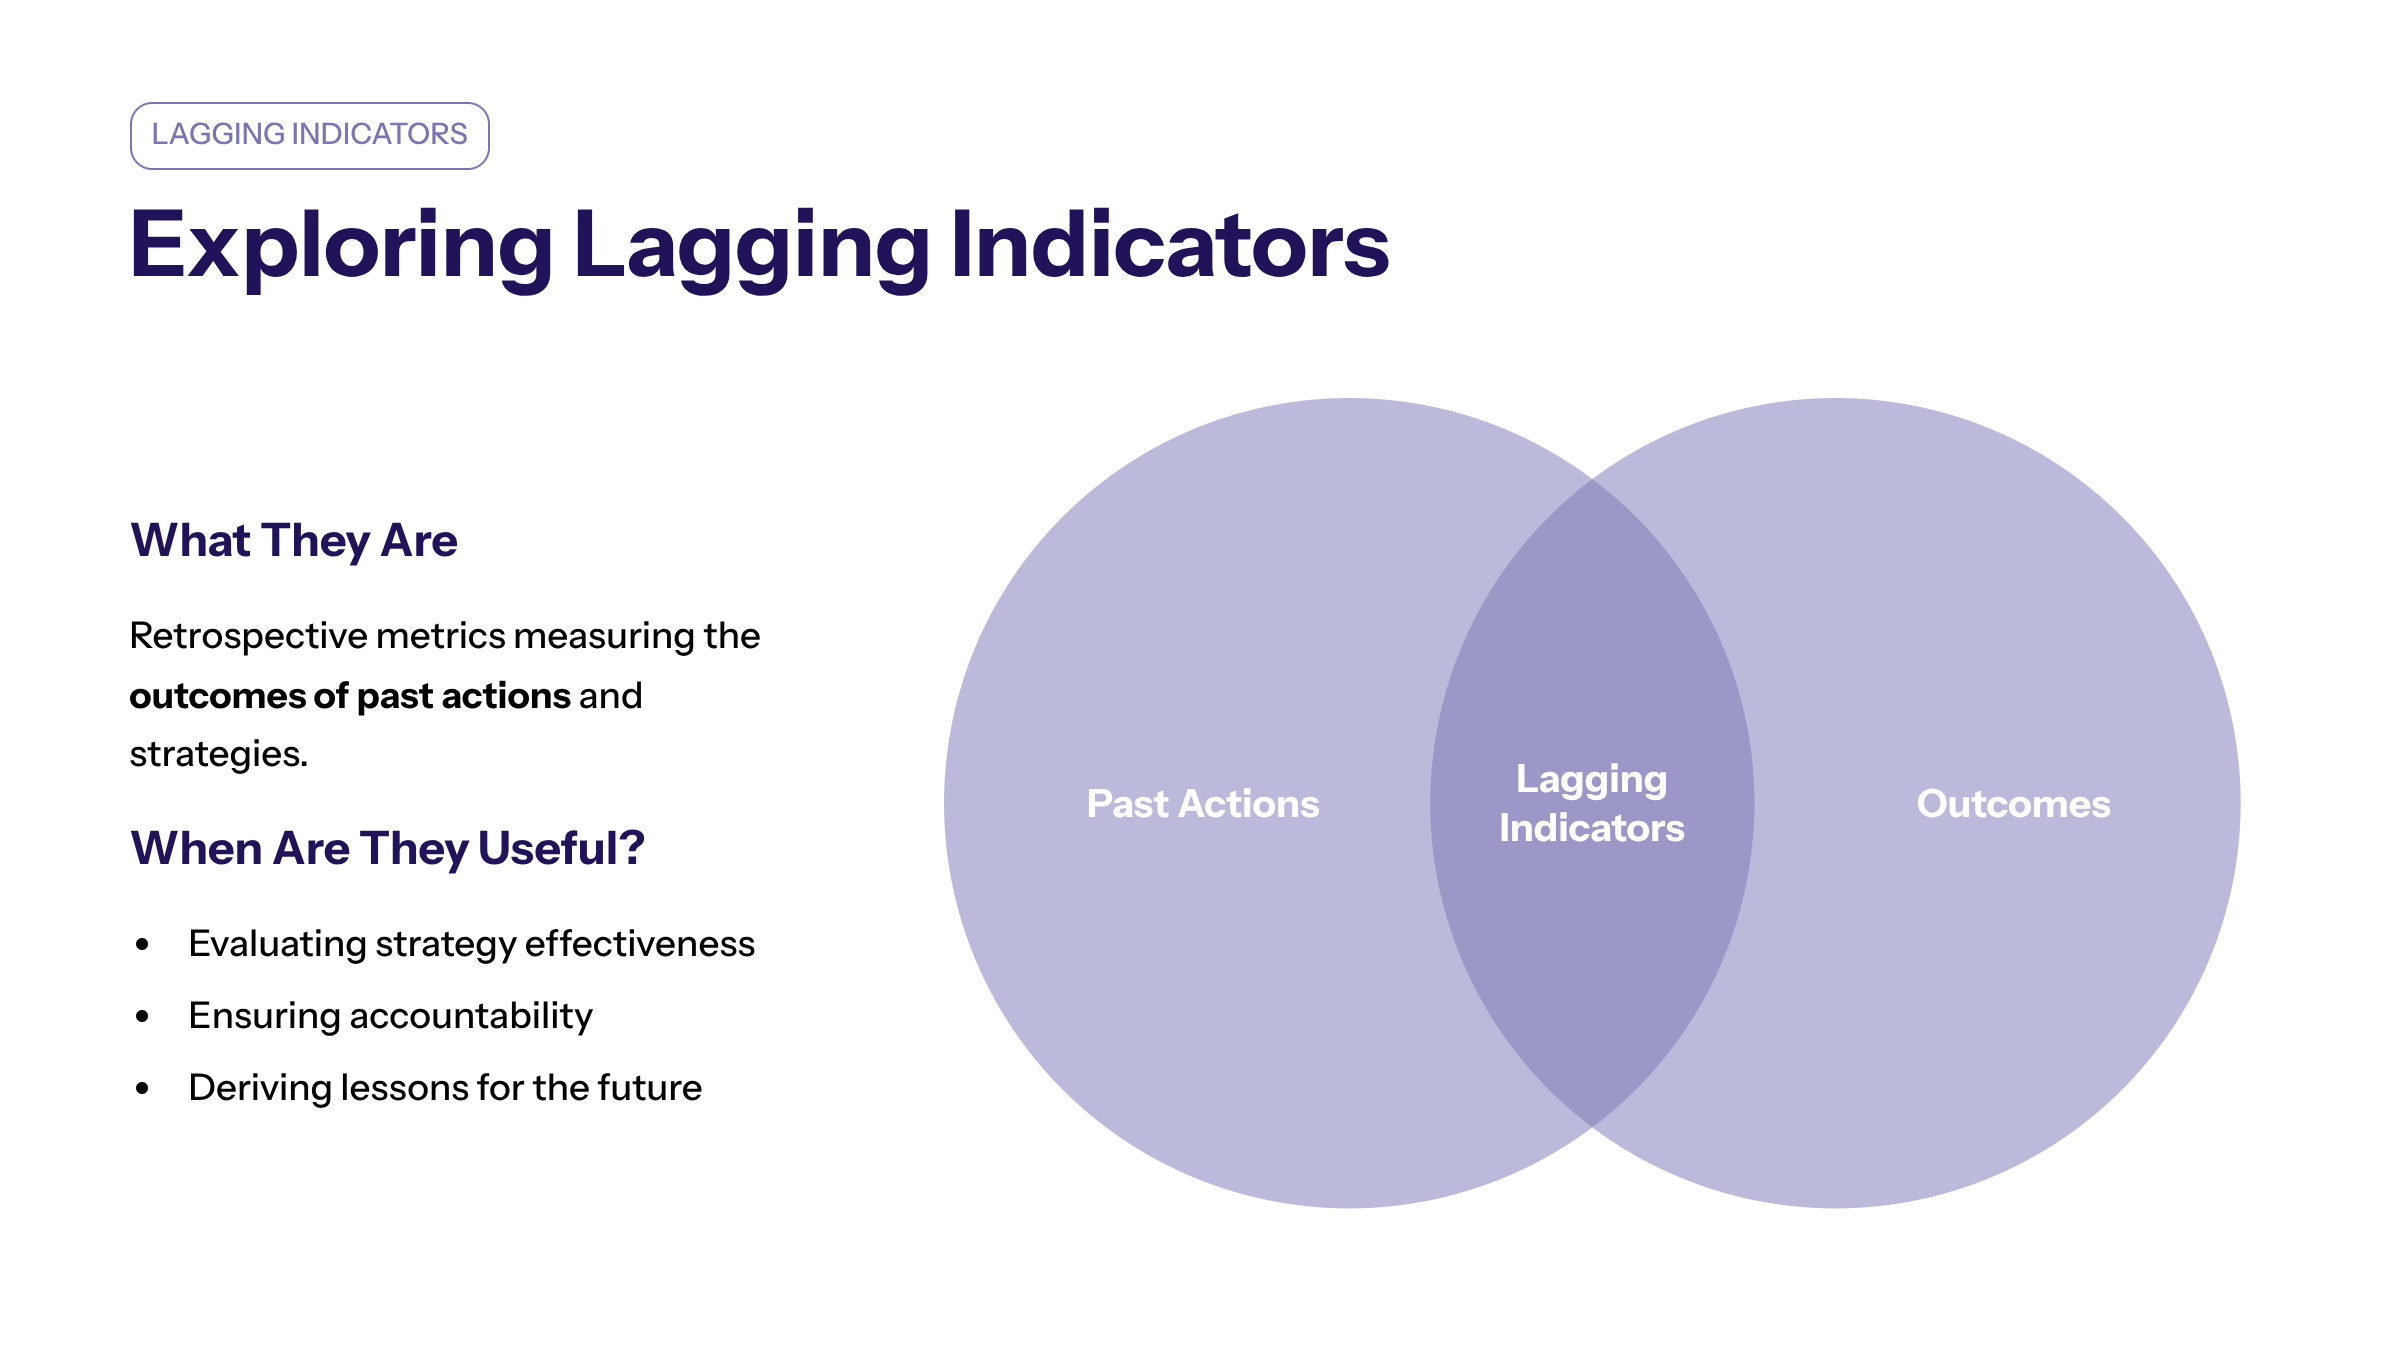
Lagging indicators provide a retrospective view, measuring the outcomes of past actions and strategies. These metrics are essential for evaluating performance, ensuring accountability, and deriving lessons to inform future strategies.
When Are Lagging Indicators Useful?
Lagging KPIs are best applied in performance reviews, financial reporting, and post-campaign analyses. For instance, total revenue generated, customer churn rates, and net promoter scores (NPS) are typical lagging indicators that reflect the success or shortcomings of prior efforts.
Advantages of Using Lagging Indicators
Promoting Accountability
By quantifying past performance, lagging KPIs hold teams and individuals responsible for delivering results aligned with business goals. This accountability fosters a culture where teams are motivated to improve continuously.
Supporting Data-Driven Decisions
Historical data provides a solid foundation for assessing strategy effectiveness, informing budget allocations, and setting realistic future targets.
Facilitating Lessons Learned
Analyzing lagging metrics helps organizations identify areas of strength and opportunities for improvement, fostering continuous improvement.
Limitations of Lagging Indicators
Backward-Looking Nature
Lagging indicators do not offer foresight, limiting their utility for proactive decision-making.
Delayed Feedback
Because these metrics are reported after outcomes occur, organizations may miss critical windows for timely intervention.
Potential for Complacency
An overreliance on lagging KPIs can create a false sense of security, assuming past success guarantees future performance.
Typical Examples of Lagging Indicators
Indicator Type | Examples | Business Function |
|---|---|---|
Financial Performance | Total revenue, profit margins | Finance |
Customer Metrics | Customer churn rate, net promoter score | Customer success team |
Operational Outcomes | Product defects, on-time delivery rates | Operations management |
"Lagging indicators are essential for understanding what has happened, but they must be complemented by leading indicators to provide a full picture of business health." — McKinsey & Company
Integrating Leading and Lagging Indicators for Comprehensive Insights
How Leading and Lagging Indicators Complement Each Other?
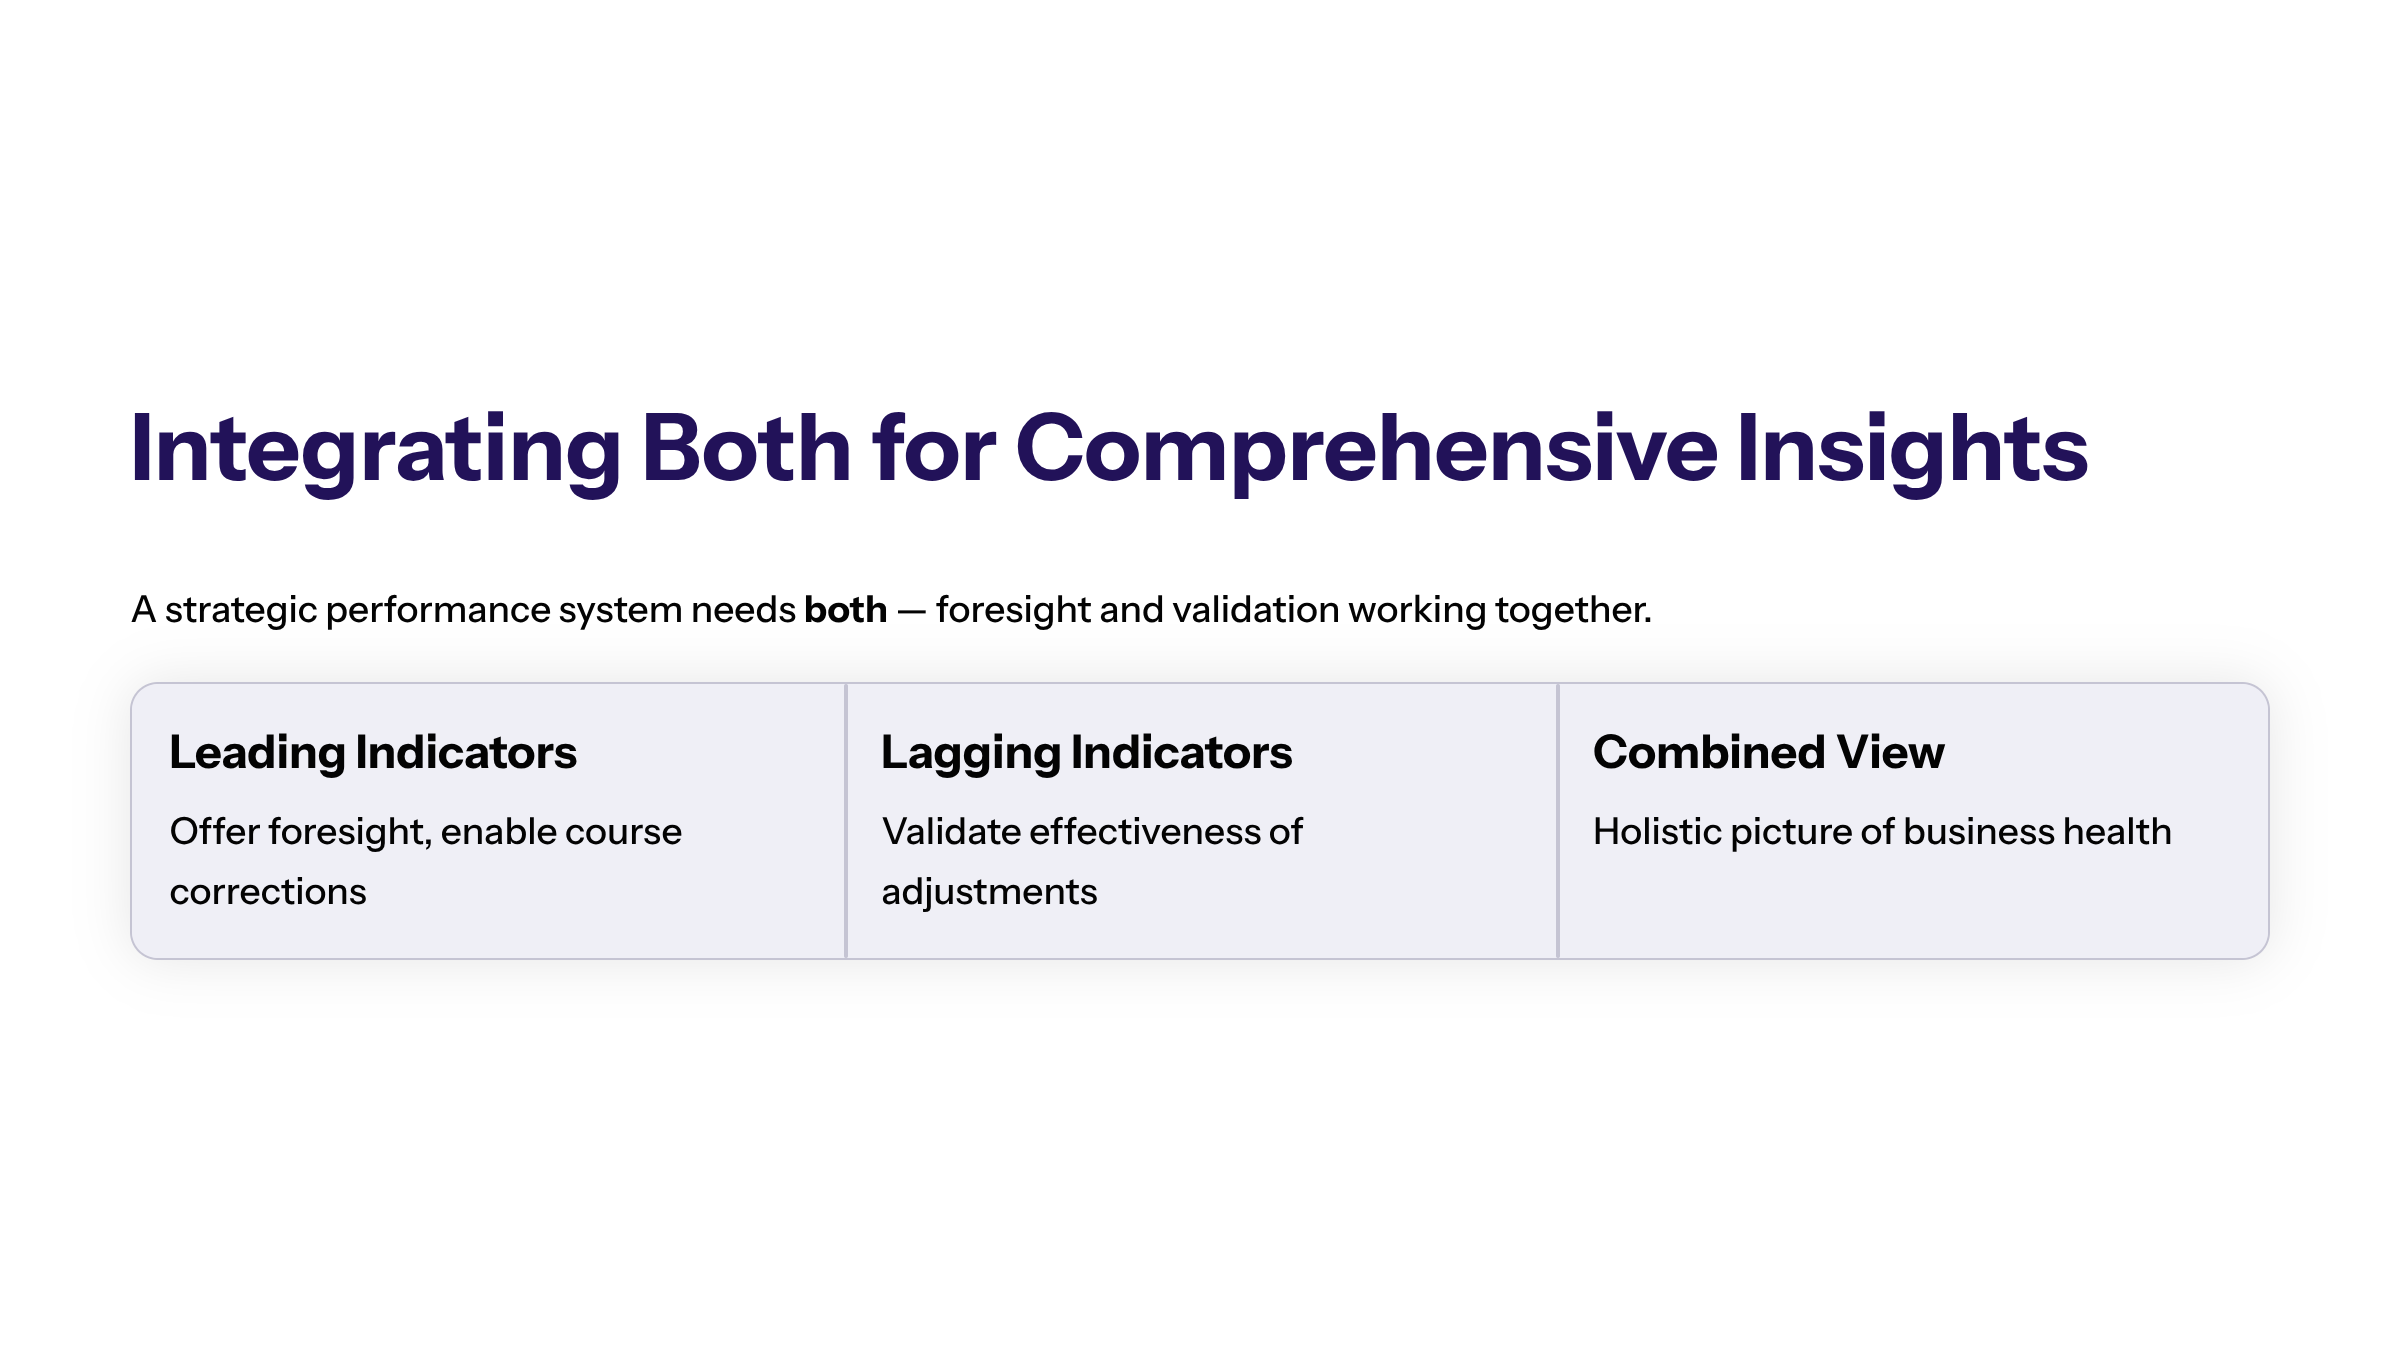
A strategic performance management system integrates both leading and lagging KPIs to provide a holistic view of business health. Leading indicators offer foresight and enable course corrections, while lagging indicators validate the effectiveness of these adjustments.
Practical Examples of Combined Use
Consider a technology company tracking its sales pipeline volume (leading KPI) alongside quarterly closed sales revenue (lagging KPI). Monitoring both allows the sales team to forecast revenue accurately and adjust outreach efforts proactively.
Similarly, a customer success team might analyze early product usage data (leading) in conjunction with customer renewal rates (lagging) to optimize retention strategies.
Business Function | Leading KPIs | Lagging KPIs | Strategic Benefit |
|---|---|---|---|
Sales | Number of qualified leads, sales cycle length | Total sales revenue, market share | Forecasting revenue and market trends |
Marketing | Website traffic, email engagement | Conversion rates, customer acquisition cost | Optimizing campaigns and ROI |
Customer Success | Product adoption, customer satisfaction scores | Customer retention, customer lifetime value | Enhancing customer loyalty and growth |
"The synergy of leading and lagging KPIs equips executives with the insights needed to drive both immediate actions and long-term strategy." — Harvard Business Review
Tools and Strategies for Tracking Leading and Lagging Indicators Effectively
Implementing a robust analytics infrastructure is critical for capturing, analyzing, and reporting KPIs. Modern platforms like Tableau, Power BI, and Salesforce enable real-time dashboarding and data visualization, facilitating timely insights.
Assigning Ownership and Accountability
Clear ownership of KPIs across departments ensures accountability and fosters a culture of continuous improvement. For example, the sales team owns pipeline metrics, while finance is responsible for revenue reporting.
Establishing Reporting Cadence
Regular reporting intervals—weekly for leading indicators and monthly or quarterly for lagging metrics—allow organizations to balance agility with comprehensive analysis.
Leveraging AI and Advanced Analytics
Artificial intelligence tools can identify patterns in data points, correlate leading and lagging indicators, and predict future trends, enhancing decision-making capabilities. In 2026, AI-driven platforms are increasingly used to identify the true drivers of growth, providing organizations with deeper insights and more accurate forecasts.
"AI-driven analytics platforms are transforming how businesses identify leading indicators, enabling more accurate forecasting and agile strategy adjustments." — Forrester Research
Building Your Toolkit for Strategic Success
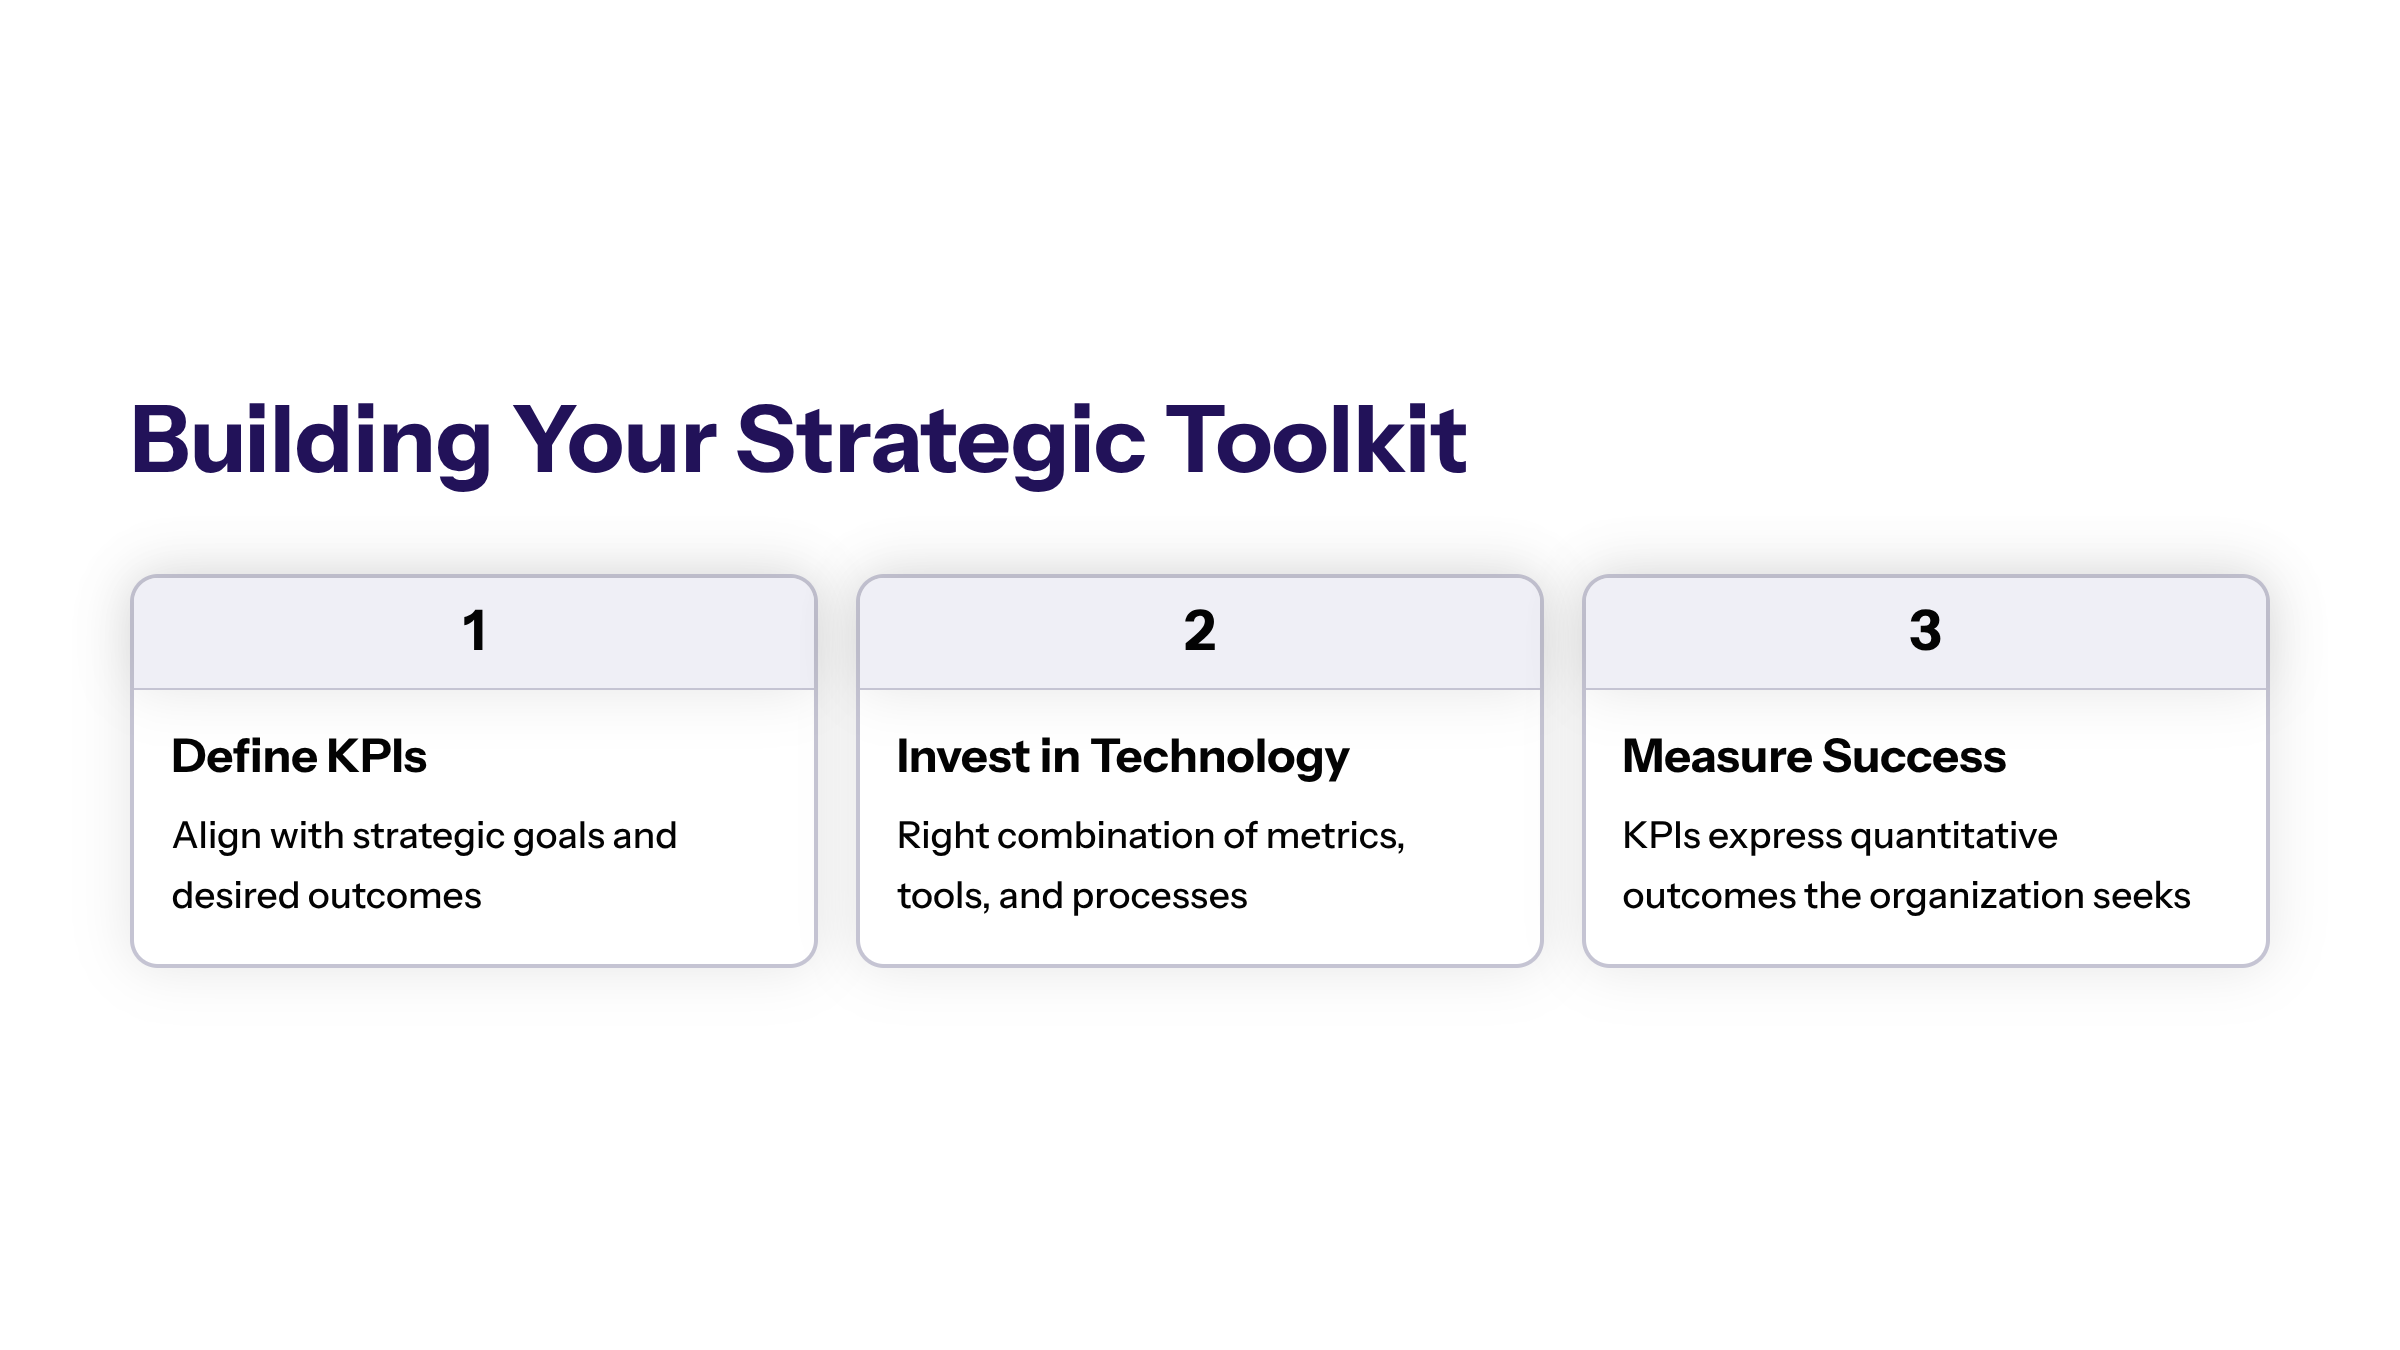
To harness the full potential of leading and lagging indicators, organizations must invest in the right combination of metrics, technologies, and processes. This includes:
Defining key performance indicators (KPIs) aligned with strategic goals and desired outcomes. KPIs express the quantitative outcomes an organization seeks and how success will be measured.
Utilizing data integration tools to consolidate data from disparate sources, ensuring a single source of truth.
Developing dashboards tailored to executive, managerial, and operational levels for targeted insights.
Training teams on data literacy and interpretation to maximize the value of metrics.
Continuously reviewing and refining KPIs to adapt to evolving business needs and market conditions. Organizations should track 5-7 KPIs to manage and track their progress against goals effectively, focusing on a few key KPIs to avoid overwhelming teams and diluting focus.
To develop KPIs, organizations should identify measures that contribute directly to their annual objectives.
Ensuring KPIs are actionable; if they cannot be influenced or adjusted, they may not be worth tracking.
Incorporating qualitative data to understand customer needs and improve KPIs. Using qualitative data allows customer success managers to tailor their strategies to meet the specific needs and challenges of different customer segments.
By adopting this comprehensive approach, businesses can enhance data-driven decision-making, improve customer retention, optimize sales cycles, and ultimately achieve sustainable revenue growth.
"The effective use of leading and lagging KPIs is a cornerstone of modern business strategy, enabling organizations to anticipate challenges, capitalize on opportunities, and maintain competitive advantage." — Deloitte Insights
Leading Indicators KPIs: Driving Business Performance with Predictive Metrics
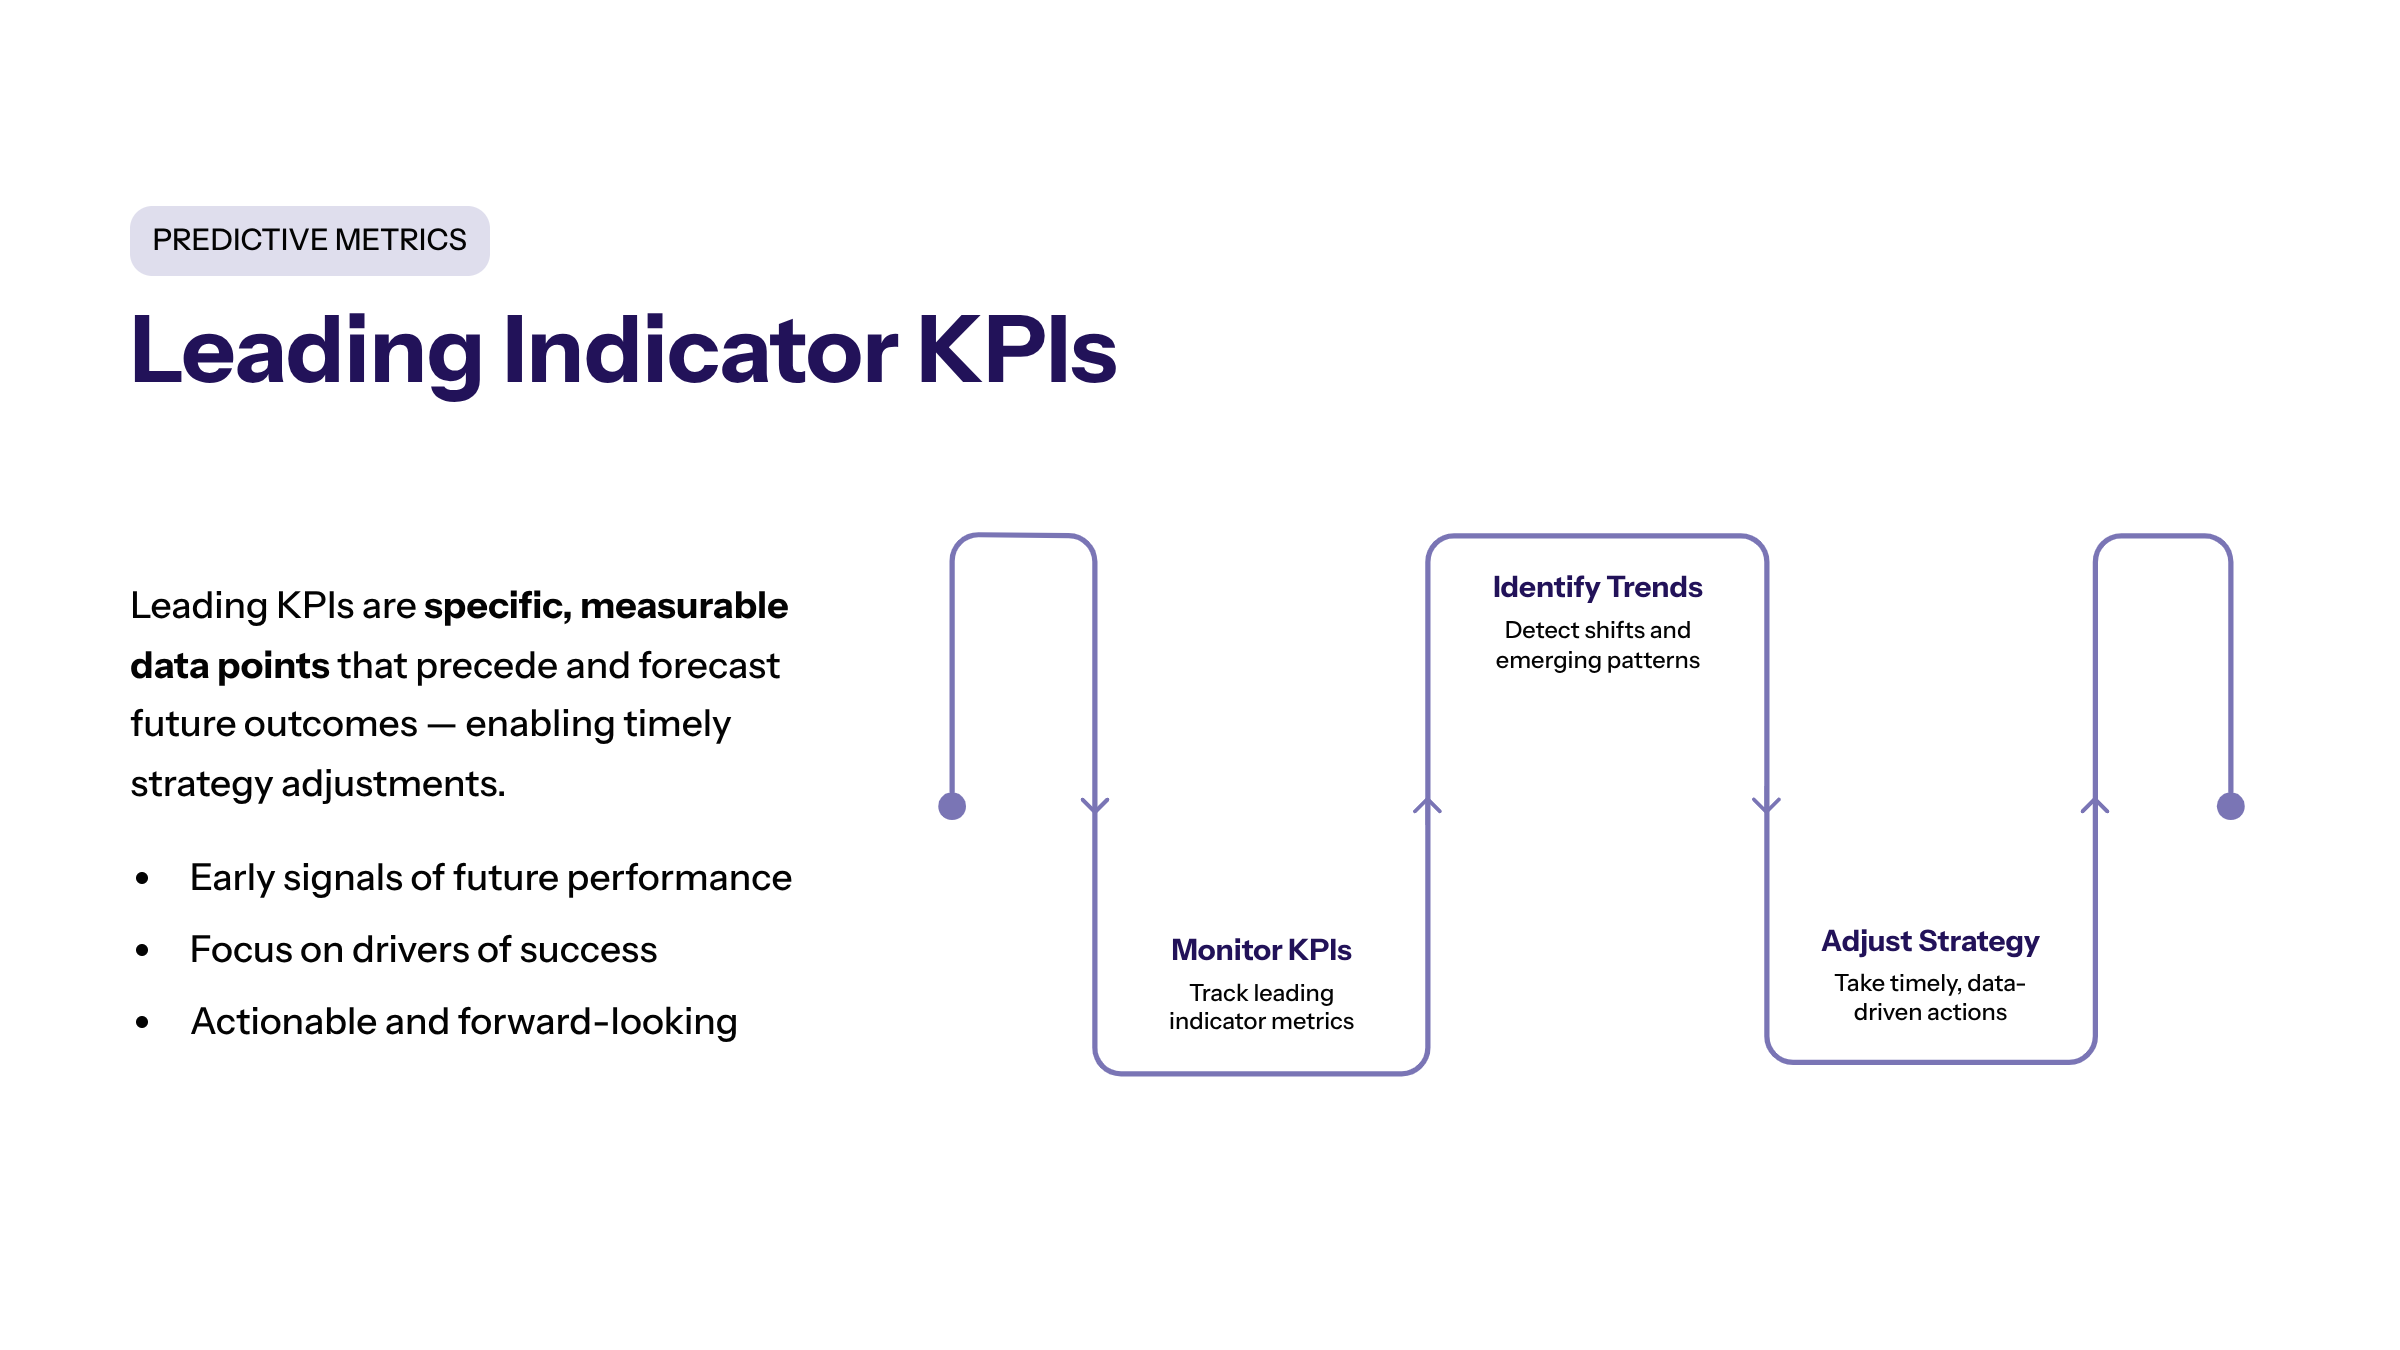
Leading indicators KPIs are essential tools that provide organizations with early signals about future business performance. These predictive metrics enable companies to focus on the drivers of success and make timely adjustments to strategies and operations.
Defining Leading Indicators KPIs
Leading indicators KPIs are specific, measurable data points that precede and forecast future outcomes. Unlike lagging indicators, which measure past results, leading KPIs help organizations anticipate changes and manage risks proactively.
Examples of Leading Indicators KPIs in Practice
Number of qualified leads generated (sales)
Website engagement rates (marketing)
Customer onboarding completion rates (customer success)
Inventory turnover rates (operations)
By tracking these leading KPIs, businesses can better align their efforts with desired outcomes and improve overall business performance.
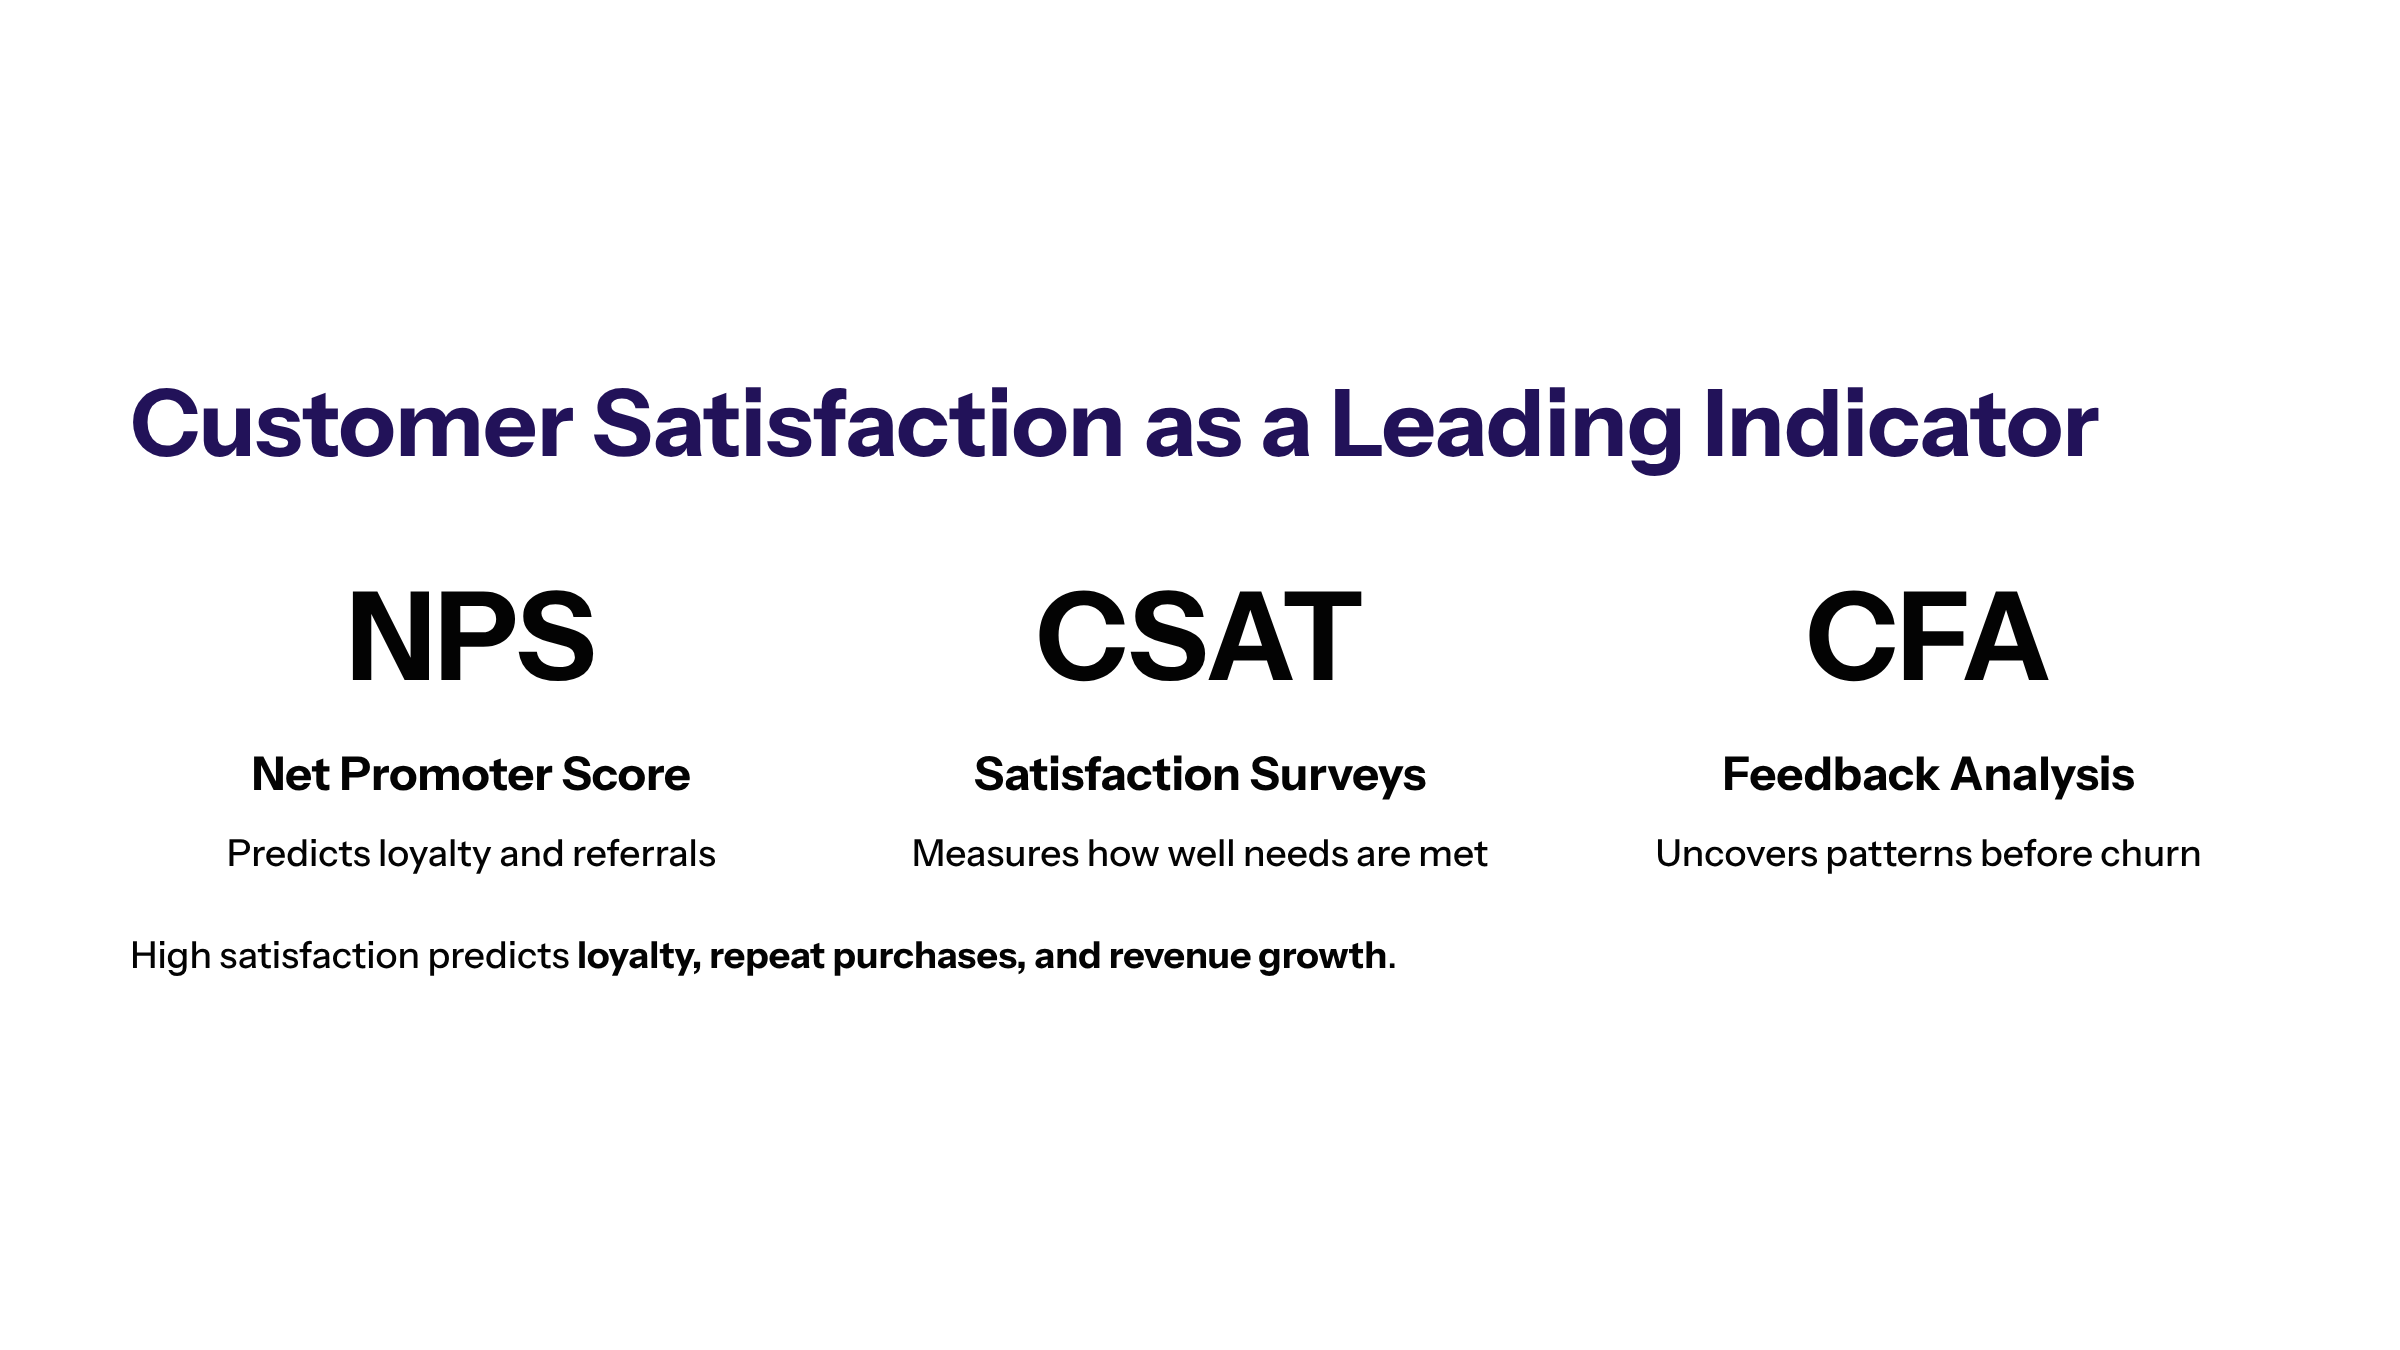
Customer Satisfaction as a Key Leading Indicator
Customer satisfaction is a crucial leading indicator KPI that reflects how well an organization meets customer needs and expectations. High levels of satisfaction often predict increased customer loyalty, repeat purchases, and positive word-of-mouth, ultimately driving revenue growth.
Measuring Customer Satisfaction
Common methods to measure customer satisfaction include surveys, net promoter scores (NPS), and customer feedback analysis. Monitoring these metrics regularly allows businesses to identify areas for improvement and enhance the customer experience.
Impact on Business Performance
Improving customer satisfaction leads to higher retention rates, increased customer lifetime value, and stronger brand reputation. As a leading indicator, it signals potential future revenue and growth opportunities.
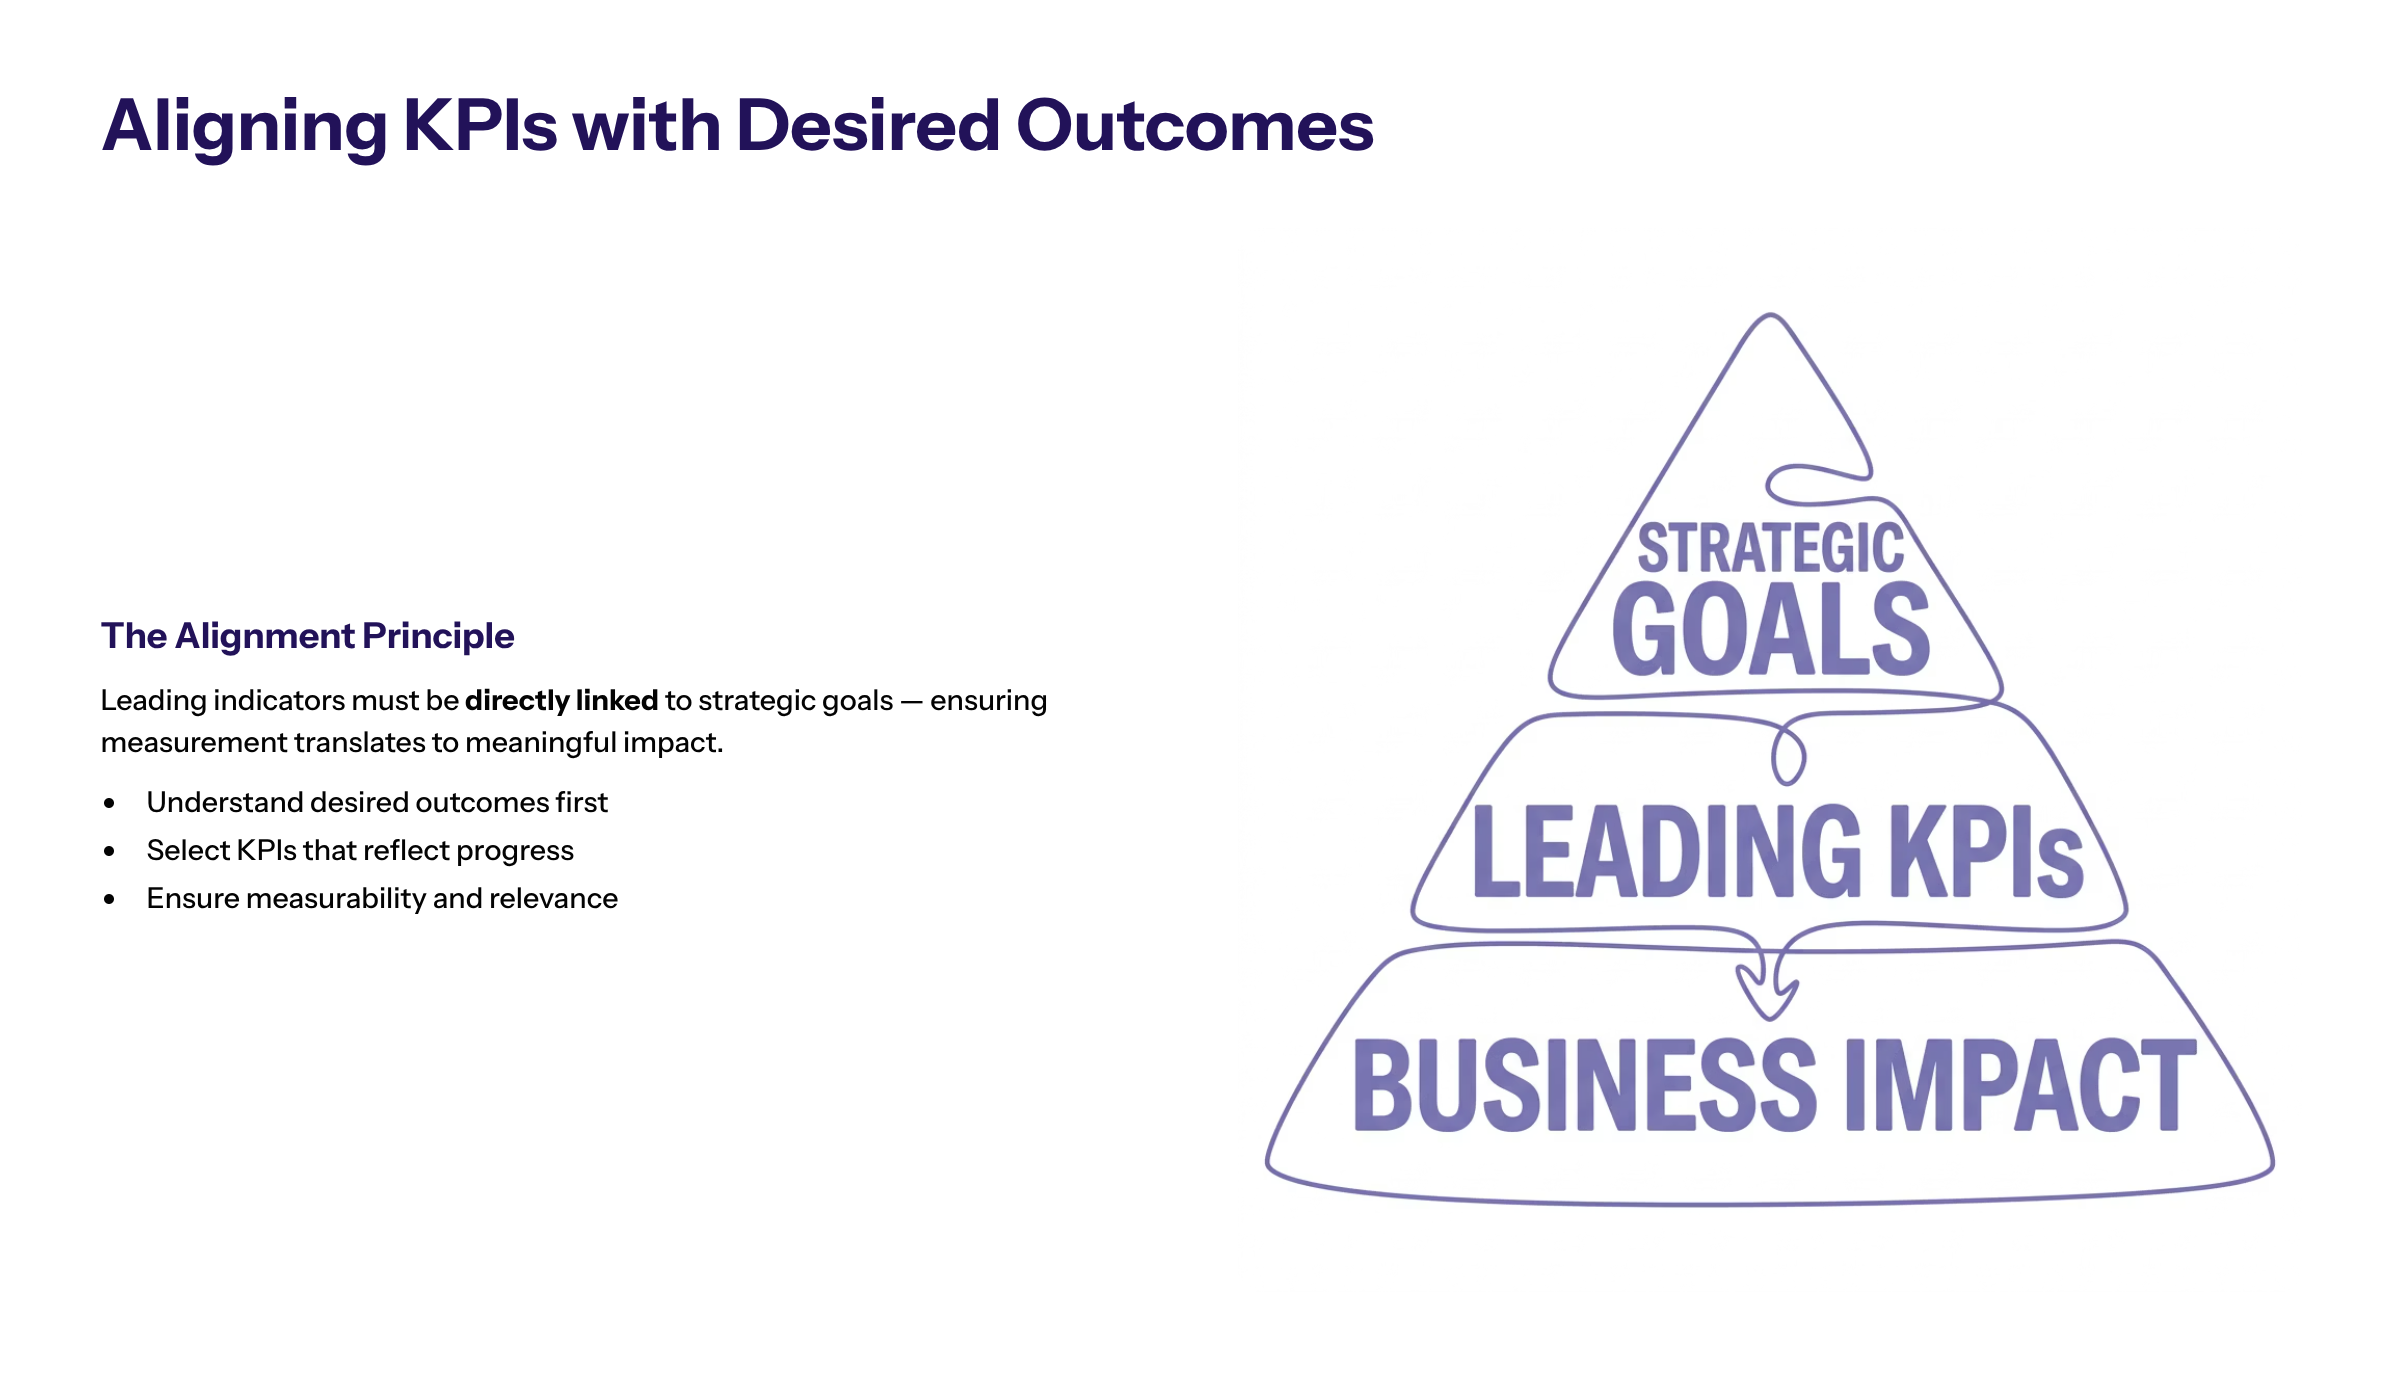
Aligning KPIs with Desired Outcomes
Effective KPI selection requires a clear understanding of the organization's desired outcomes. Leading indicators should be directly linked to these goals to ensure that measurement efforts translate into meaningful business impact.
Setting Relevant KPIs
Organizations must identify which leading KPIs best reflect progress toward their strategic objectives. For example, if the desired outcome is increased market share, relevant leading indicators might include brand awareness metrics or new customer acquisition rates.
Monitoring and Adjusting
Regularly reviewing KPIs in the context of desired outcomes helps organizations stay agile and responsive to changing market conditions.
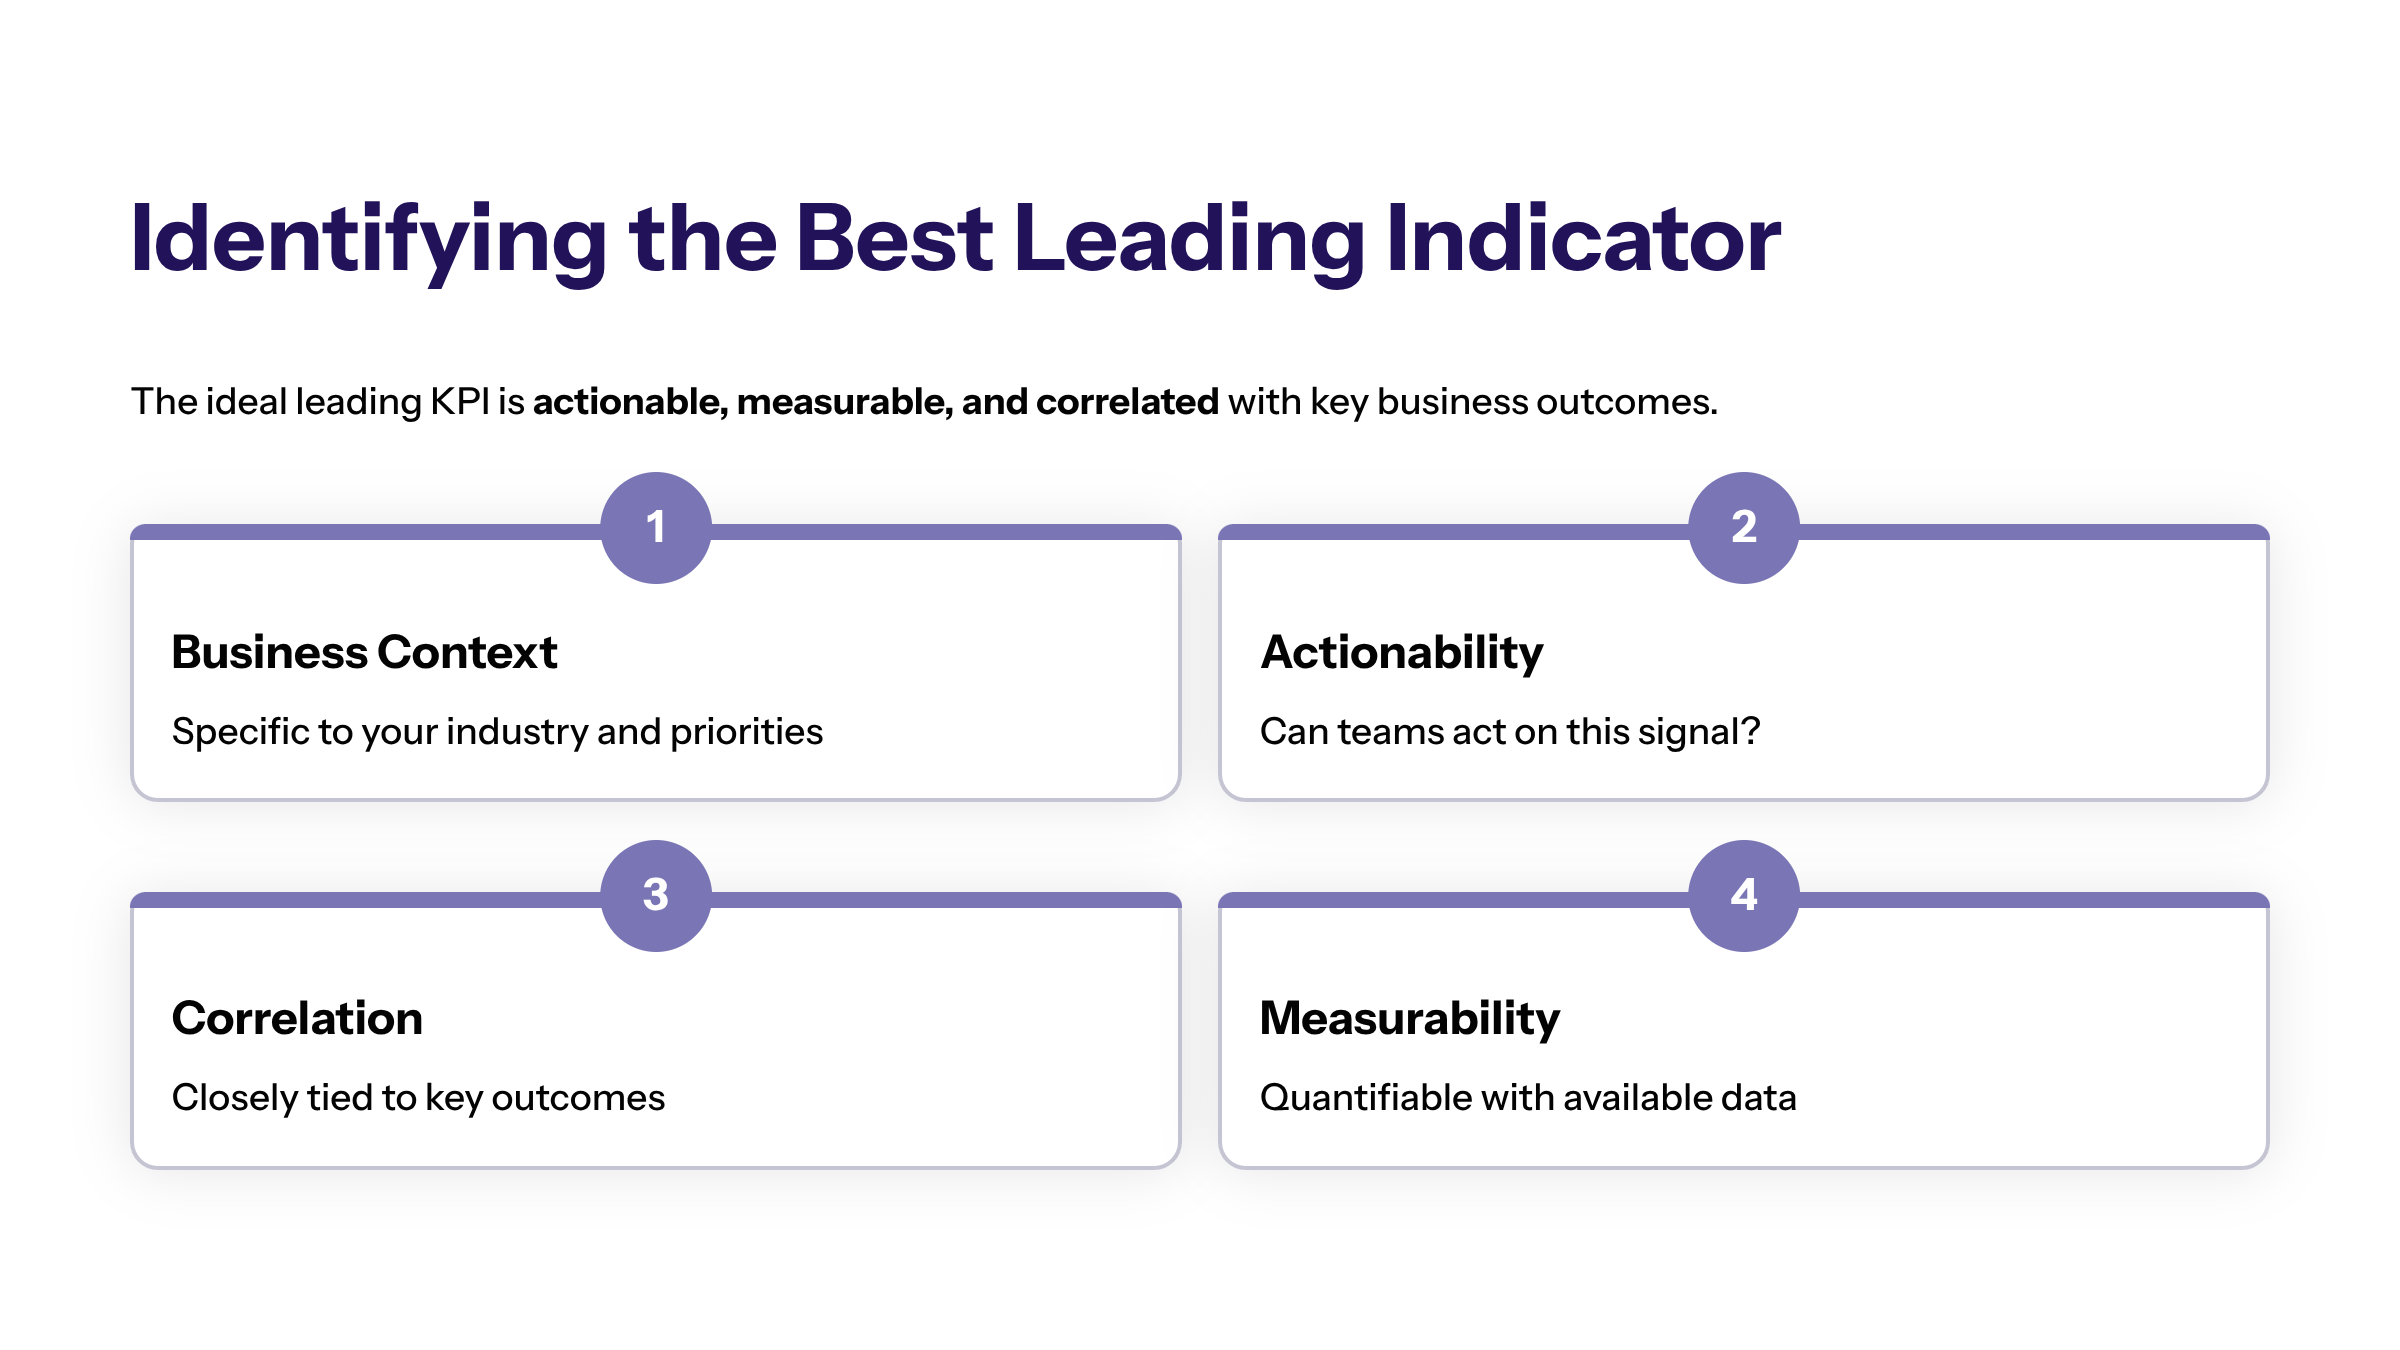
Identifying the Best Leading Indicator for Your Business
Choosing the best leading indicator depends on the specific business context, industry, and strategic priorities. The ideal leading KPI should be actionable, measurable, and closely correlated with key business outcomes.
Criteria for Selecting the Best Leading Indicator
Predictive accuracy: Ability to forecast future results reliably
Relevance: Alignment with strategic goals and customer needs
Timeliness: Provides early enough signals for corrective action
Simplicity: Easy to understand and communicate across teams
Examples of Best Leading Indicators
Sales pipeline volume for revenue forecasting
Customer engagement scores for retention prediction
Website traffic for marketing campaign effectiveness
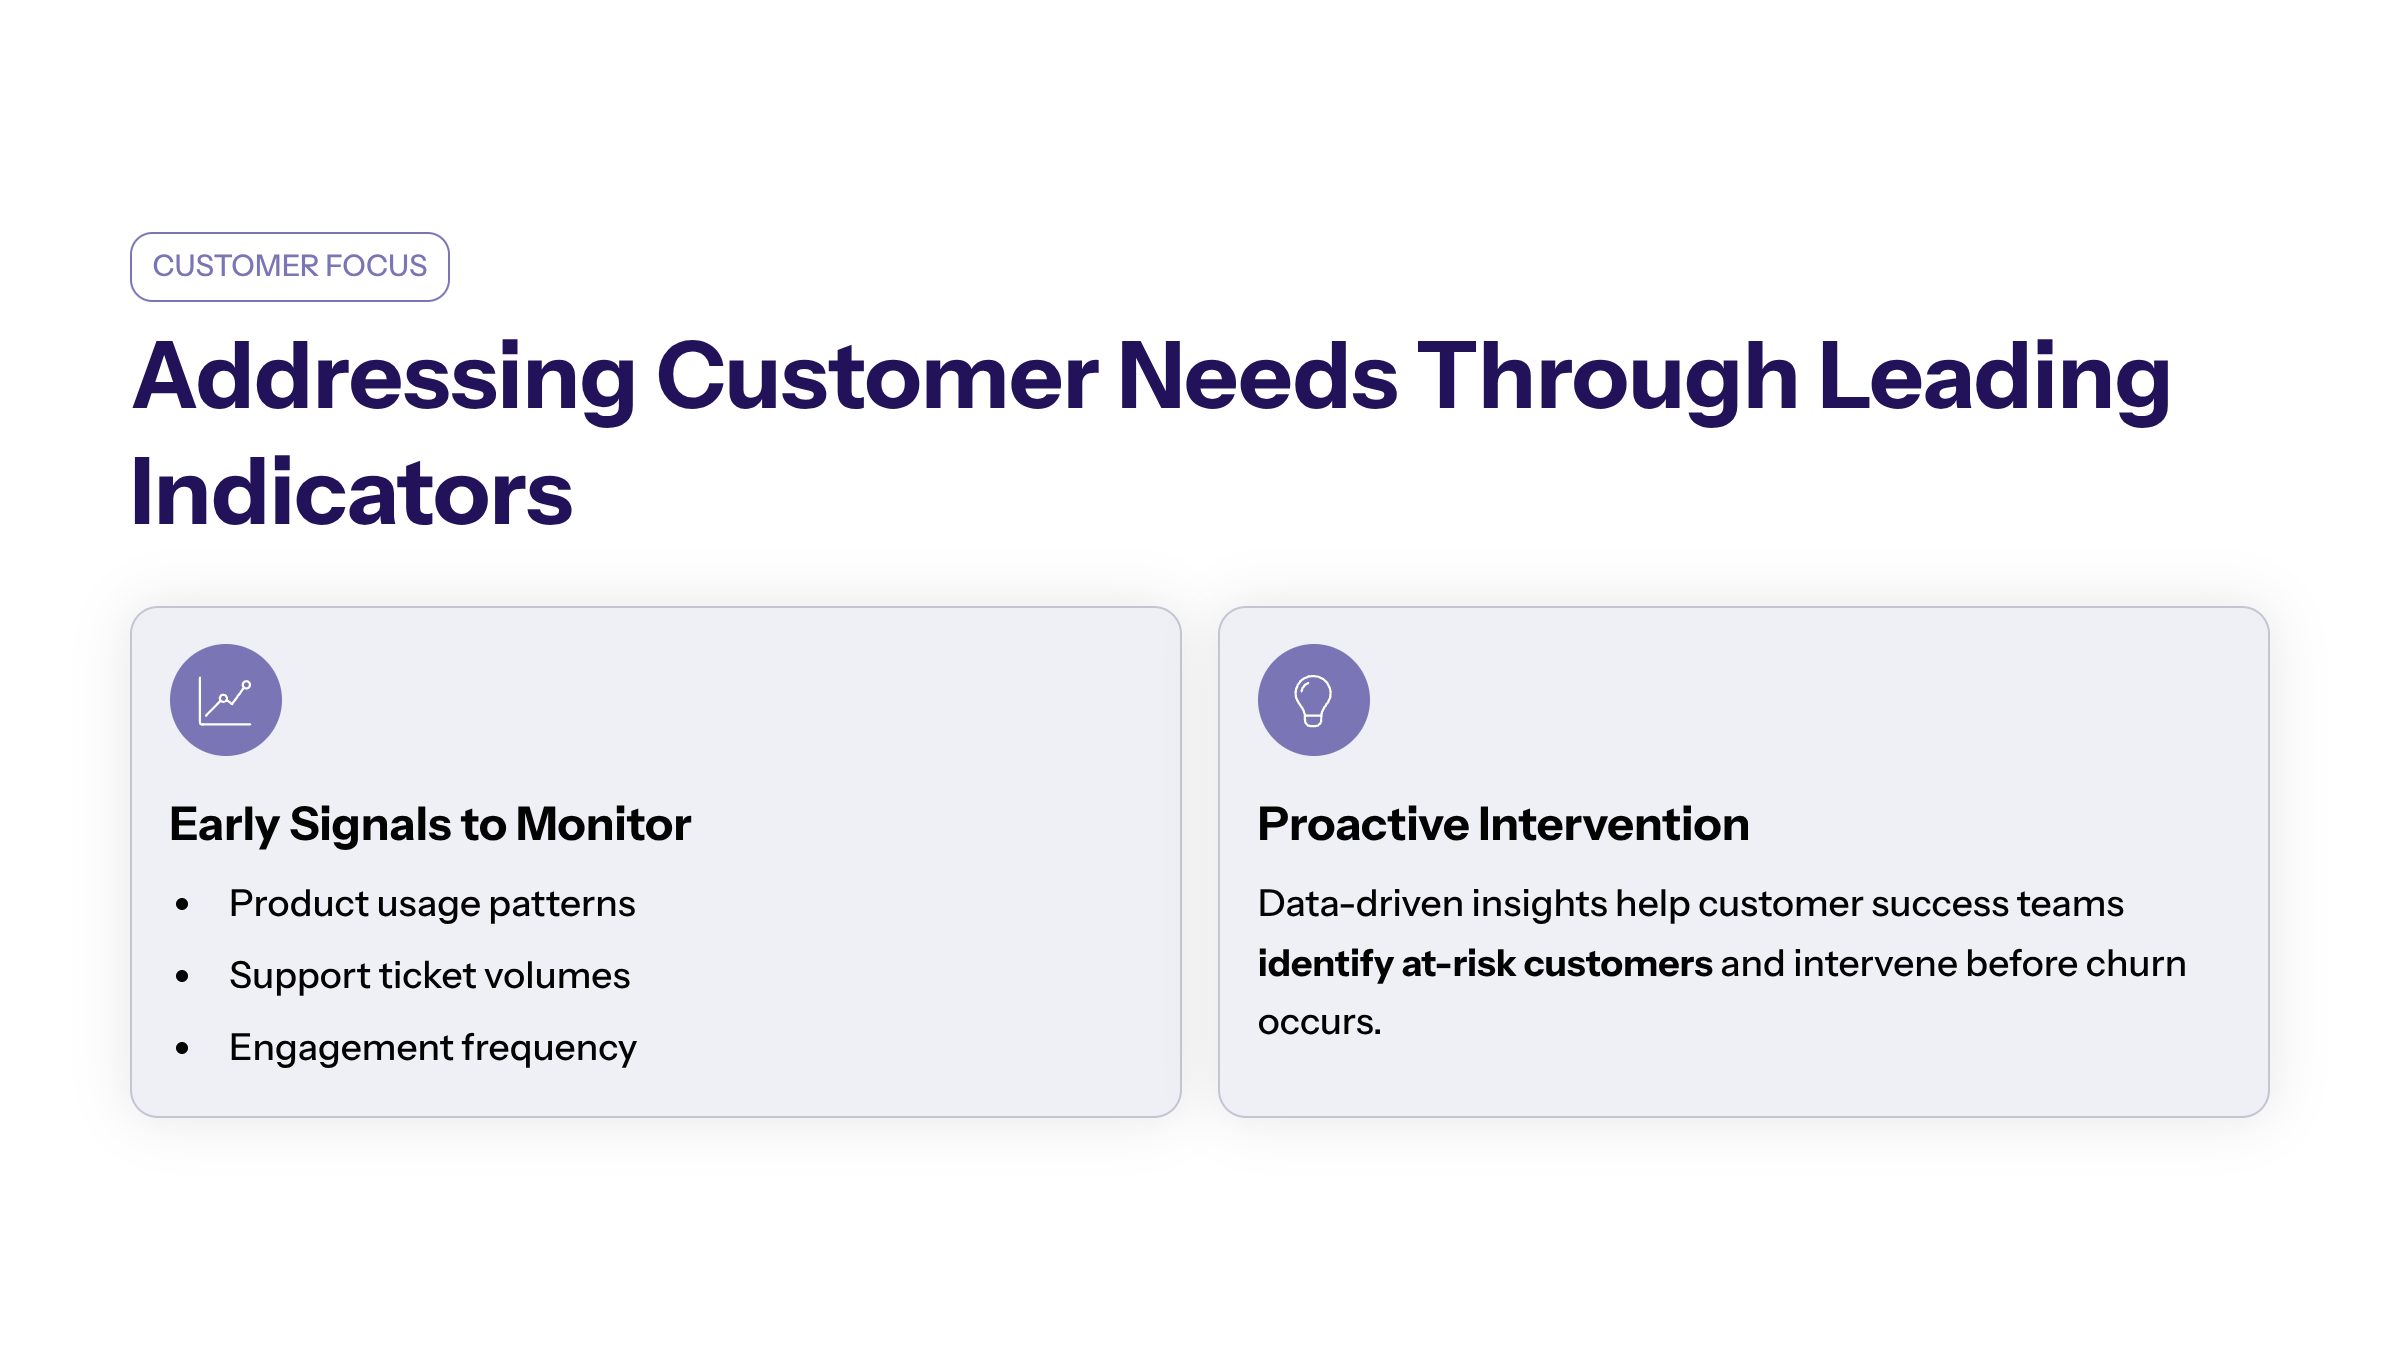
Addressing Customer Needs through Leading Indicators
Leading indicators KPIs enable organizations to better understand and respond to customer needs. By monitoring early signals such as product usage patterns or support ticket volumes, businesses can tailor their offerings and services proactively.
Enhancing Customer-Centric Strategies
Data-driven insights from leading KPIs allow customer success teams to identify at-risk customers and intervene before churn occurs, improving satisfaction and loyalty.
Driving Continuous Improvement
Feedback loops created by tracking customer-related leading indicators support ongoing product and service enhancements aligned with evolving customer expectations.
Qualitative data plays a vital role here. Customer success professionals can use qualitative data from customer feedback to identify areas for improvement and enhance customer satisfaction.
Analyzing qualitative data from customer interactions helps customer success teams understand the reasons behind customer churn and inform retention strategies.
Moreover, qualitative data can be used to track customer sentiment and engagement, which are important for predicting future customer behavior and success. Customer success teams can leverage qualitative data to create a narrative around customer experiences, which can be more compelling than quantitative data alone.
These qualitative insights help identify best practices and successful strategies that can be replicated across different customer segments.
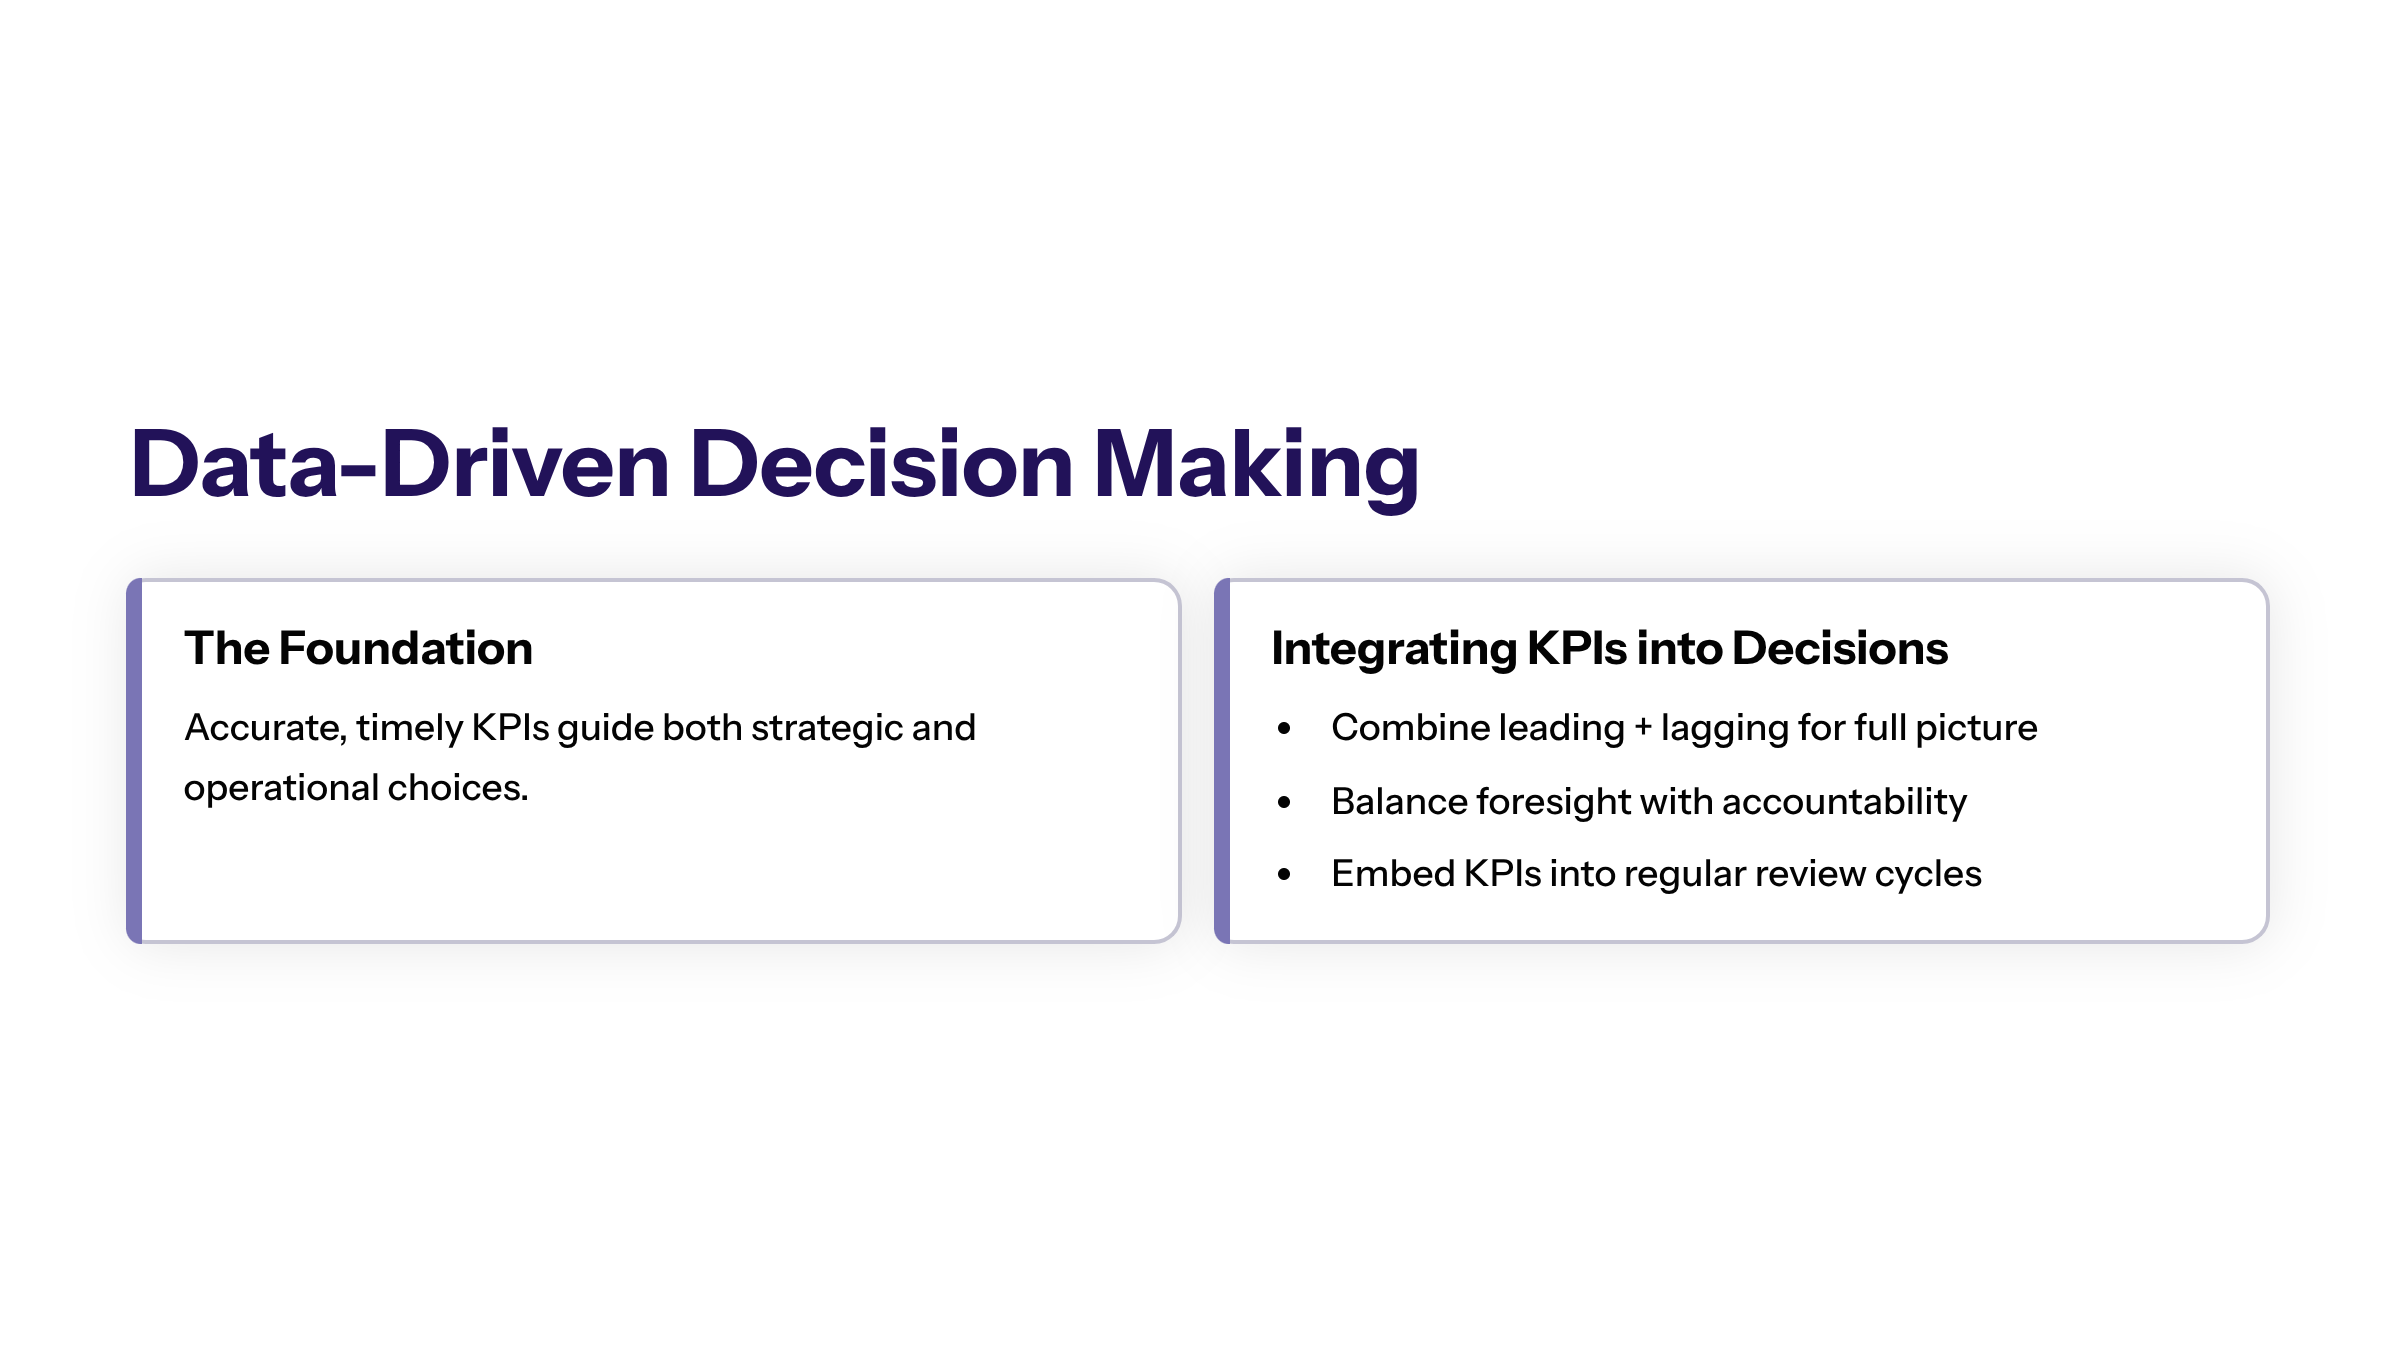
Data-Driven Decision Making: Leveraging Leading and Lagging KPIs
Data-driven decision making relies on accurate and timely KPIs to guide strategic and operational choices. Combining leading and lagging indicators provides a comprehensive view that balances foresight with accountability.
Integrating KPIs into Decision Processes
Organizations should embed KPI tracking into regular review cycles, using dashboards and analytics tools to inform discussions and actions.
Benefits of Data-Driven Approaches
Improved accuracy in forecasting and planning
Enhanced ability to identify and mitigate risks early
Greater alignment of resources with strategic priorities
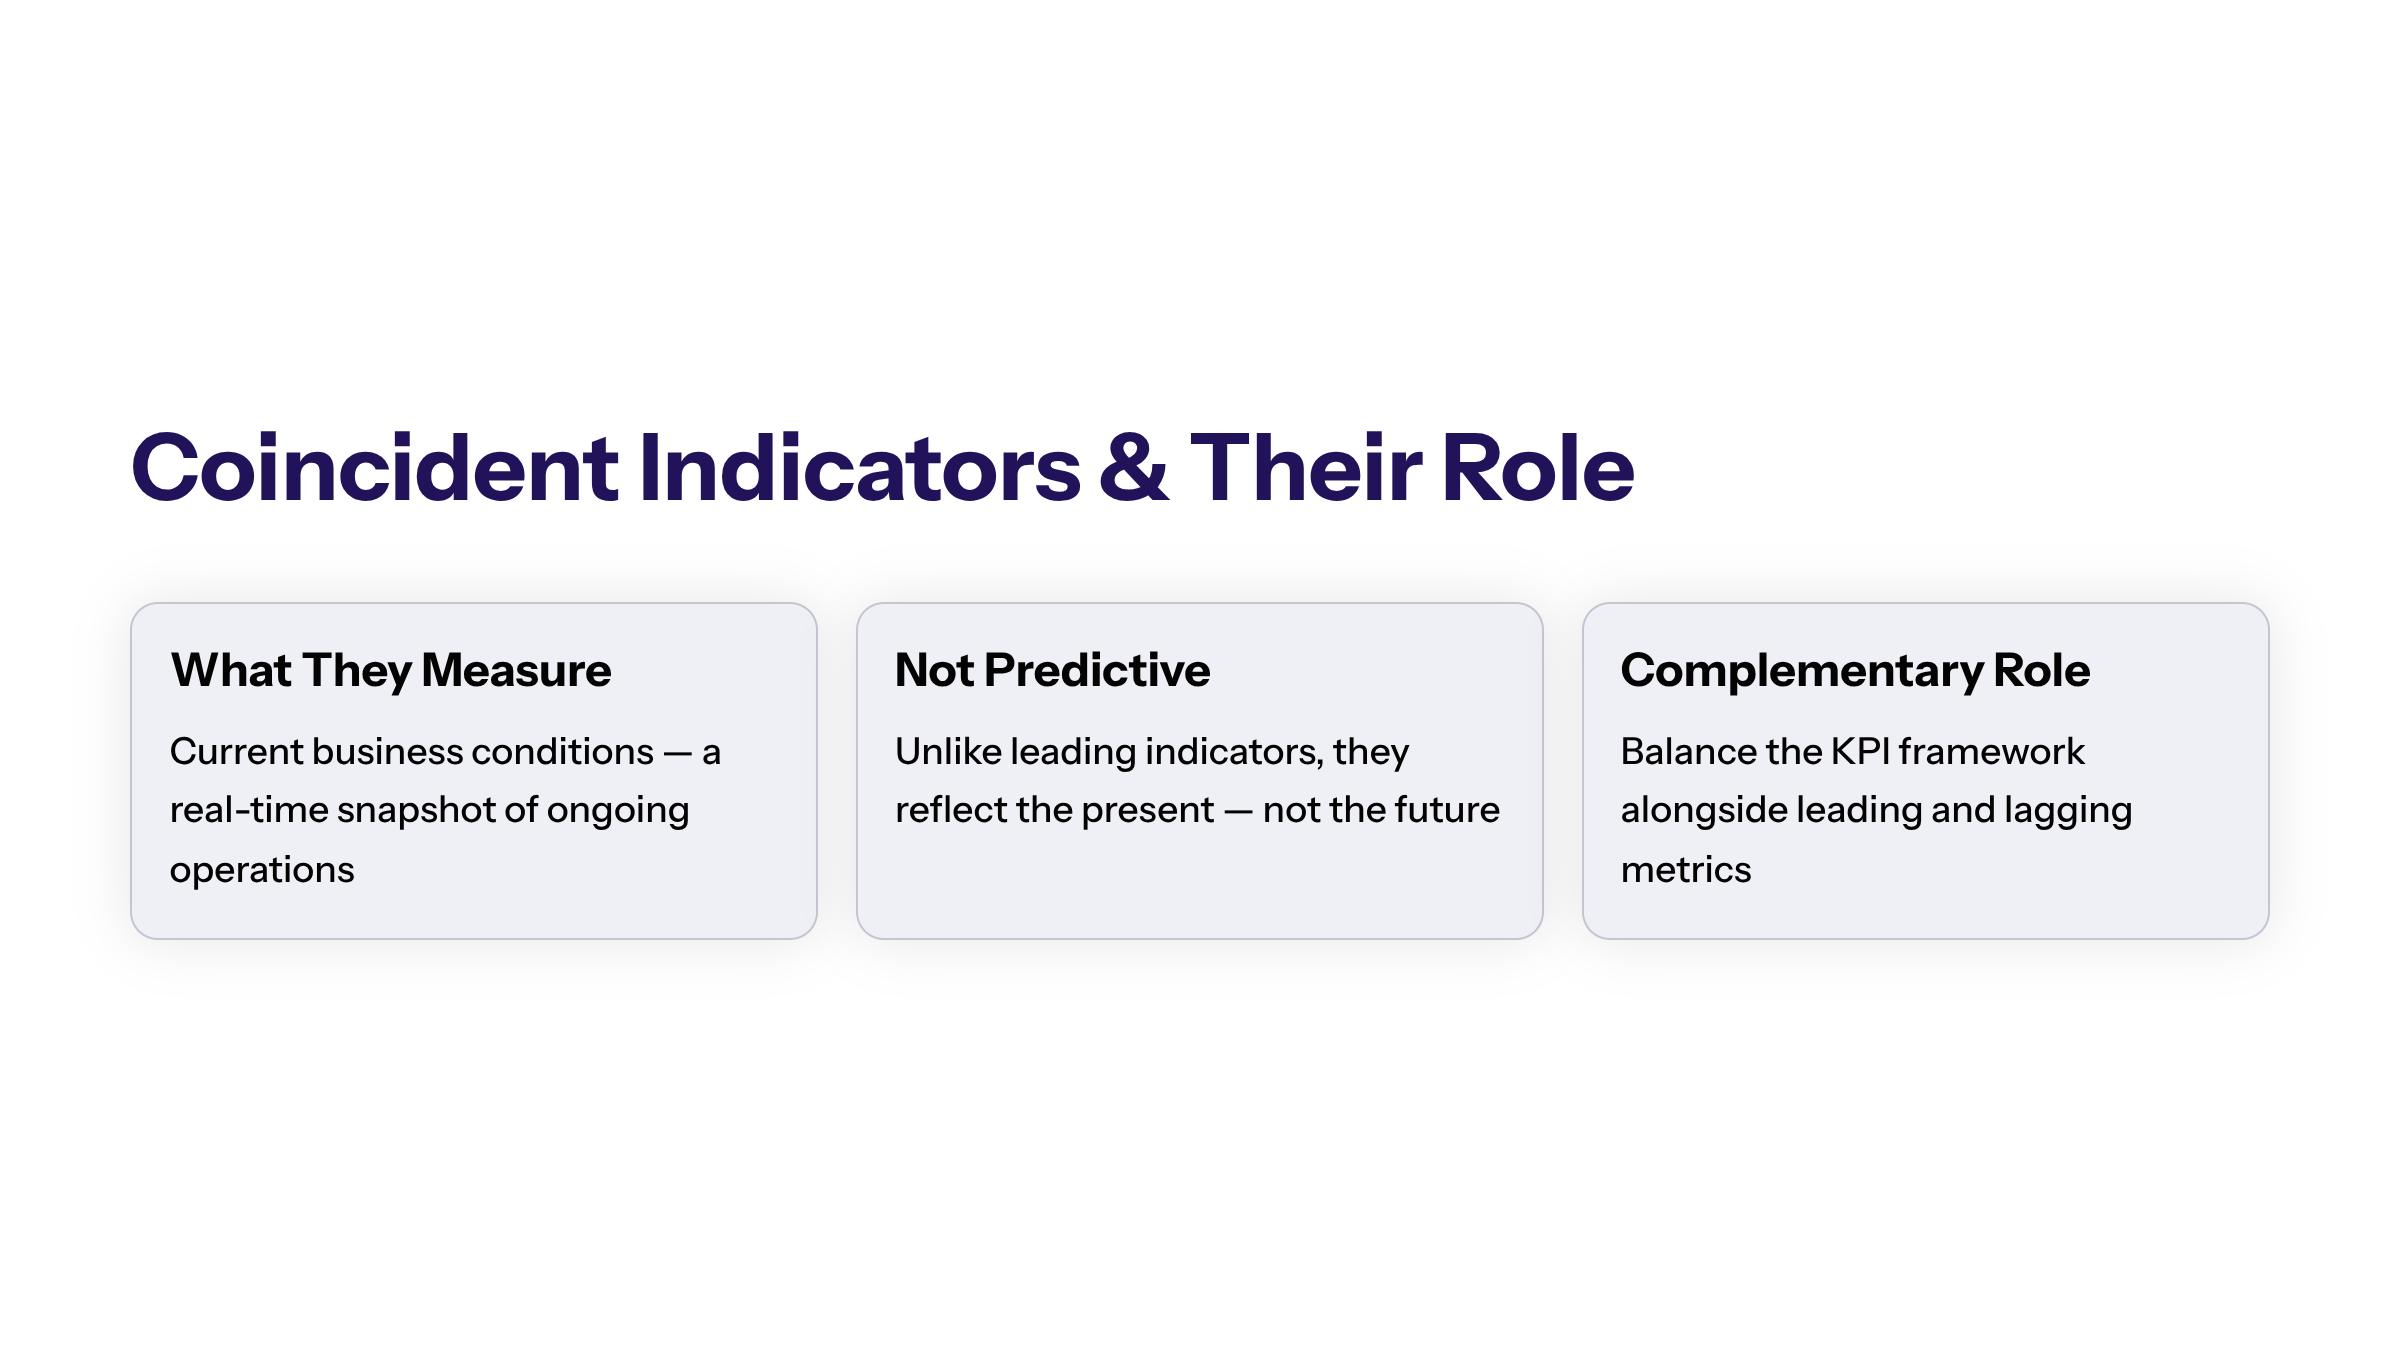
Understanding Coincident Indicators and Their Role
Coincident indicators measure current business conditions and provide real-time insights into performance. While not predictive like leading indicators, they complement the overall KPI framework by offering a snapshot of ongoing operations.
Examples of Coincident Indicators
Current sales volume
Real-time website traffic
Daily production output
Balancing Coincident Indicators with Leading and Lagging KPIs
Incorporating coincident indicators alongside leading and lagging KPIs helps organizations maintain situational awareness and make informed decisions based on both current status and future projections.
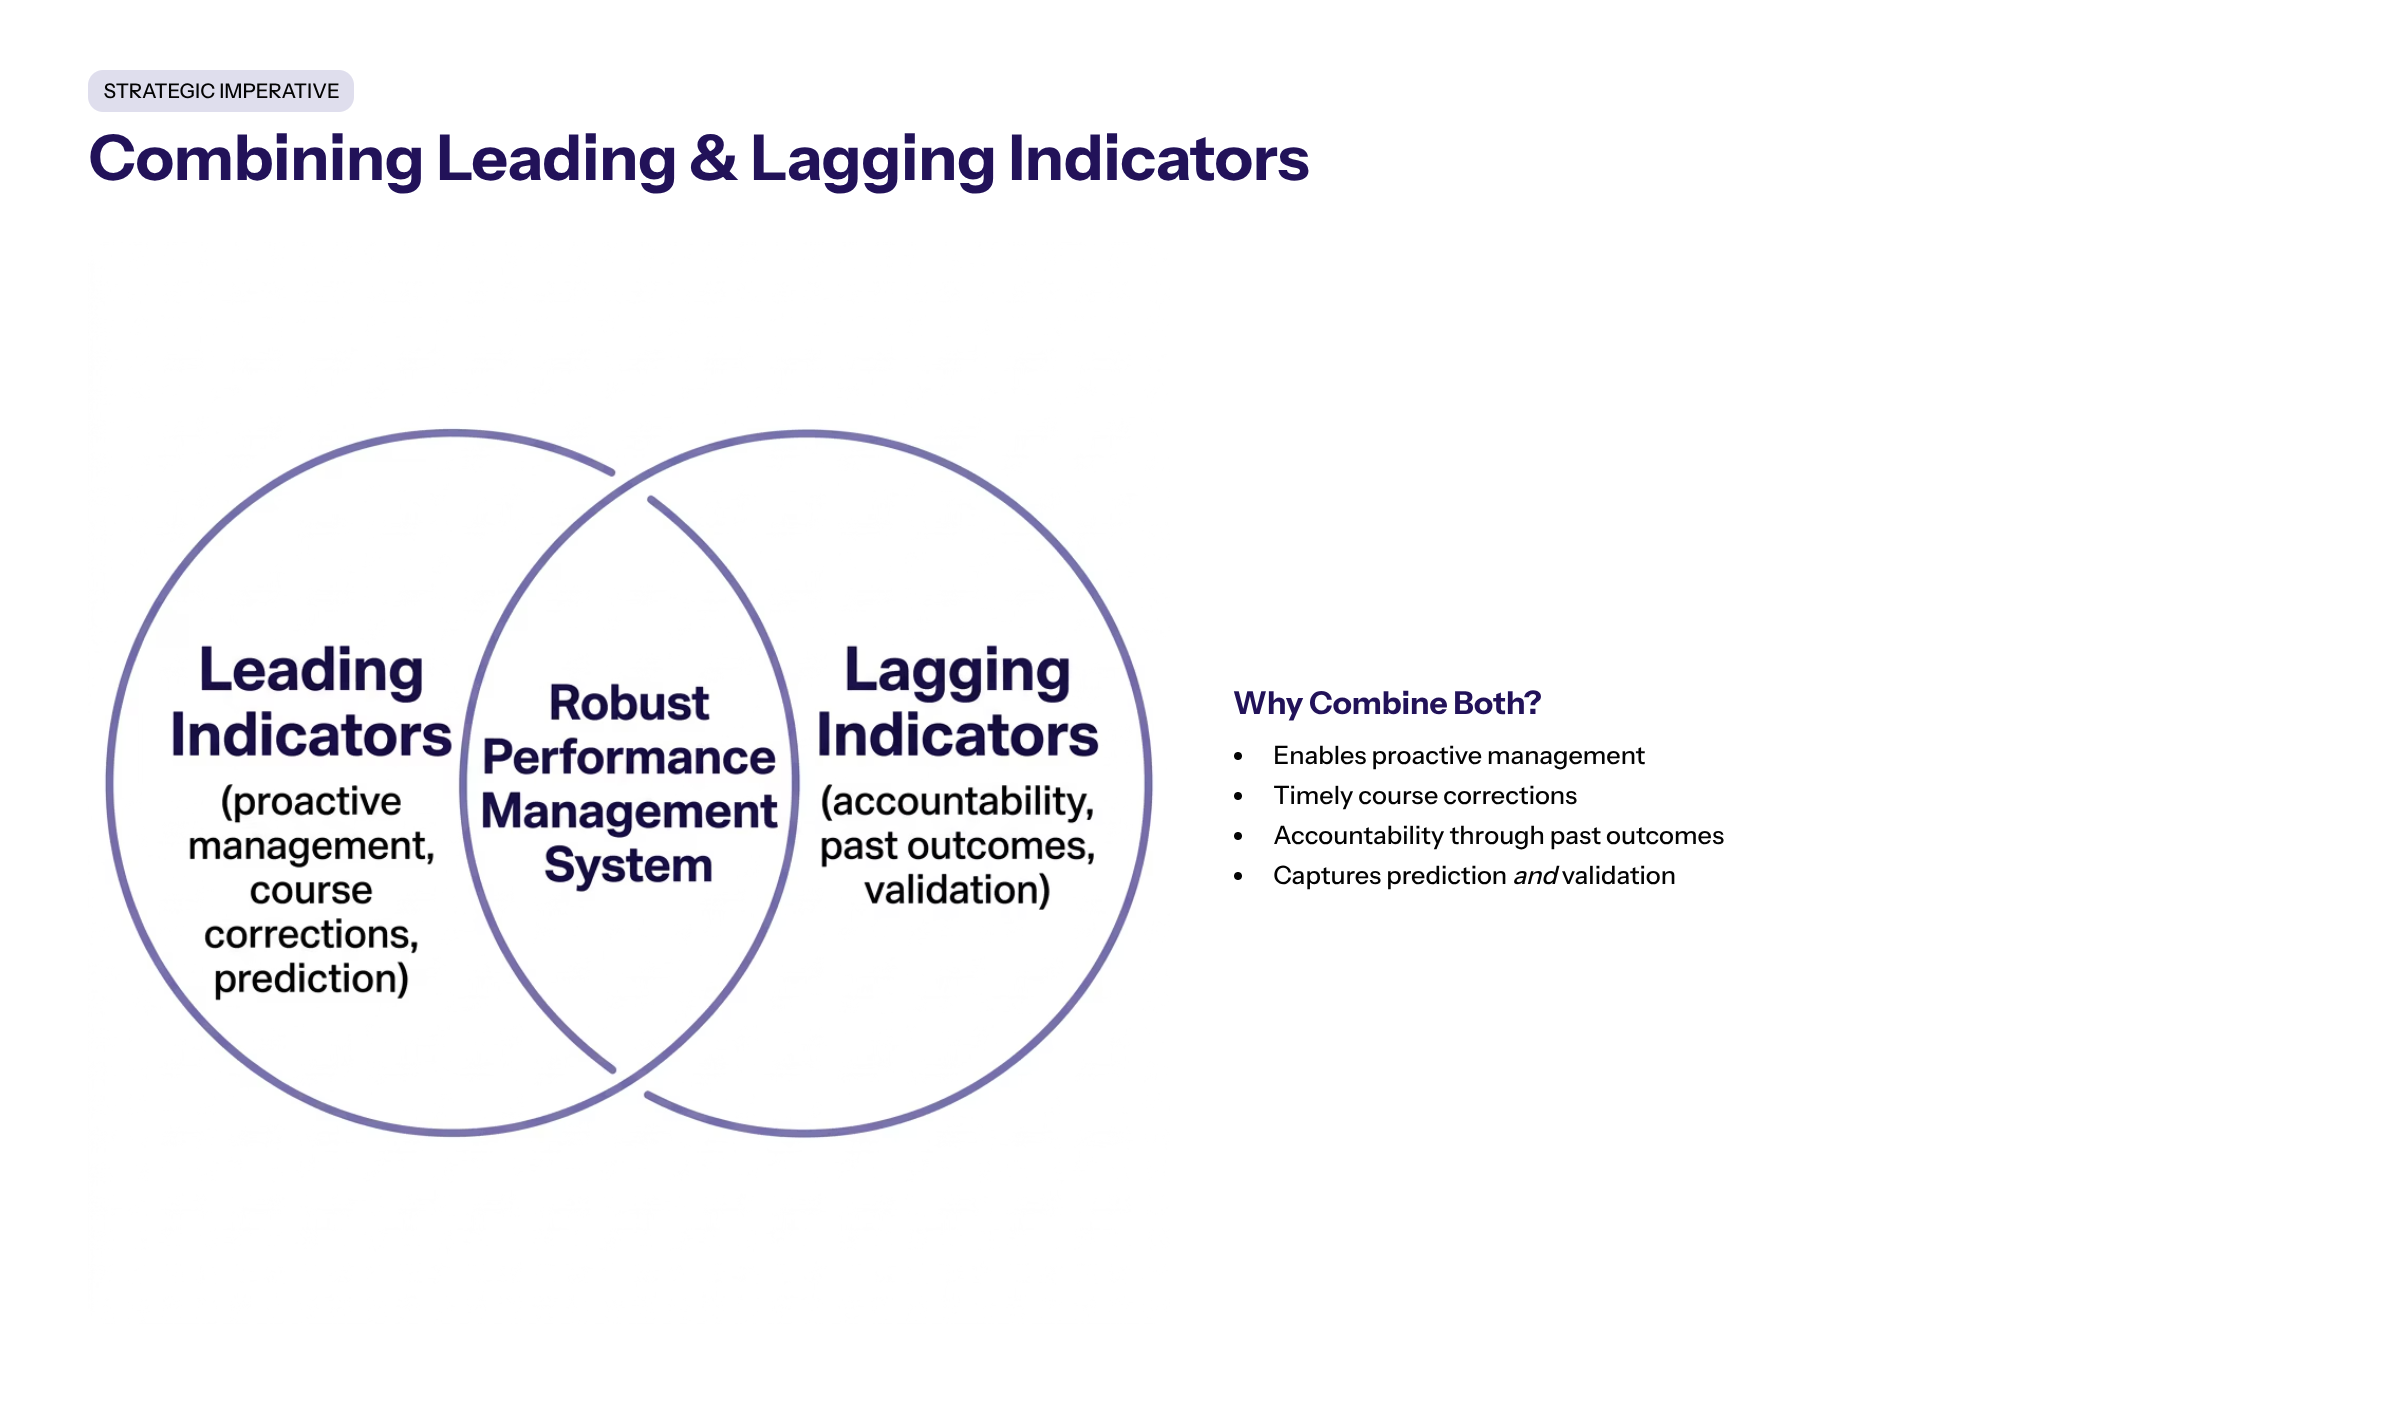
Combining Leading and Lagging Indicators: A Strategic Imperative
Combining leading and lagging indicators creates a robust performance management system that captures both prediction and validation aspects of business success.
Benefits of Combining Indicators
Enables proactive management and timely course corrections
Provides accountability through measurement of past outcomes
Supports comprehensive performance analysis and continuous improvement
Best Practices for Combining Indicators
Align indicators with strategic objectives and desired outcomes
Limit the number of KPIs to maintain focus and clarity
Ensure data quality and consistency across metrics
Foster cross-functional collaboration in KPI development and review
Balancing Leading and Lagging KPIs for Optimal Business Performance
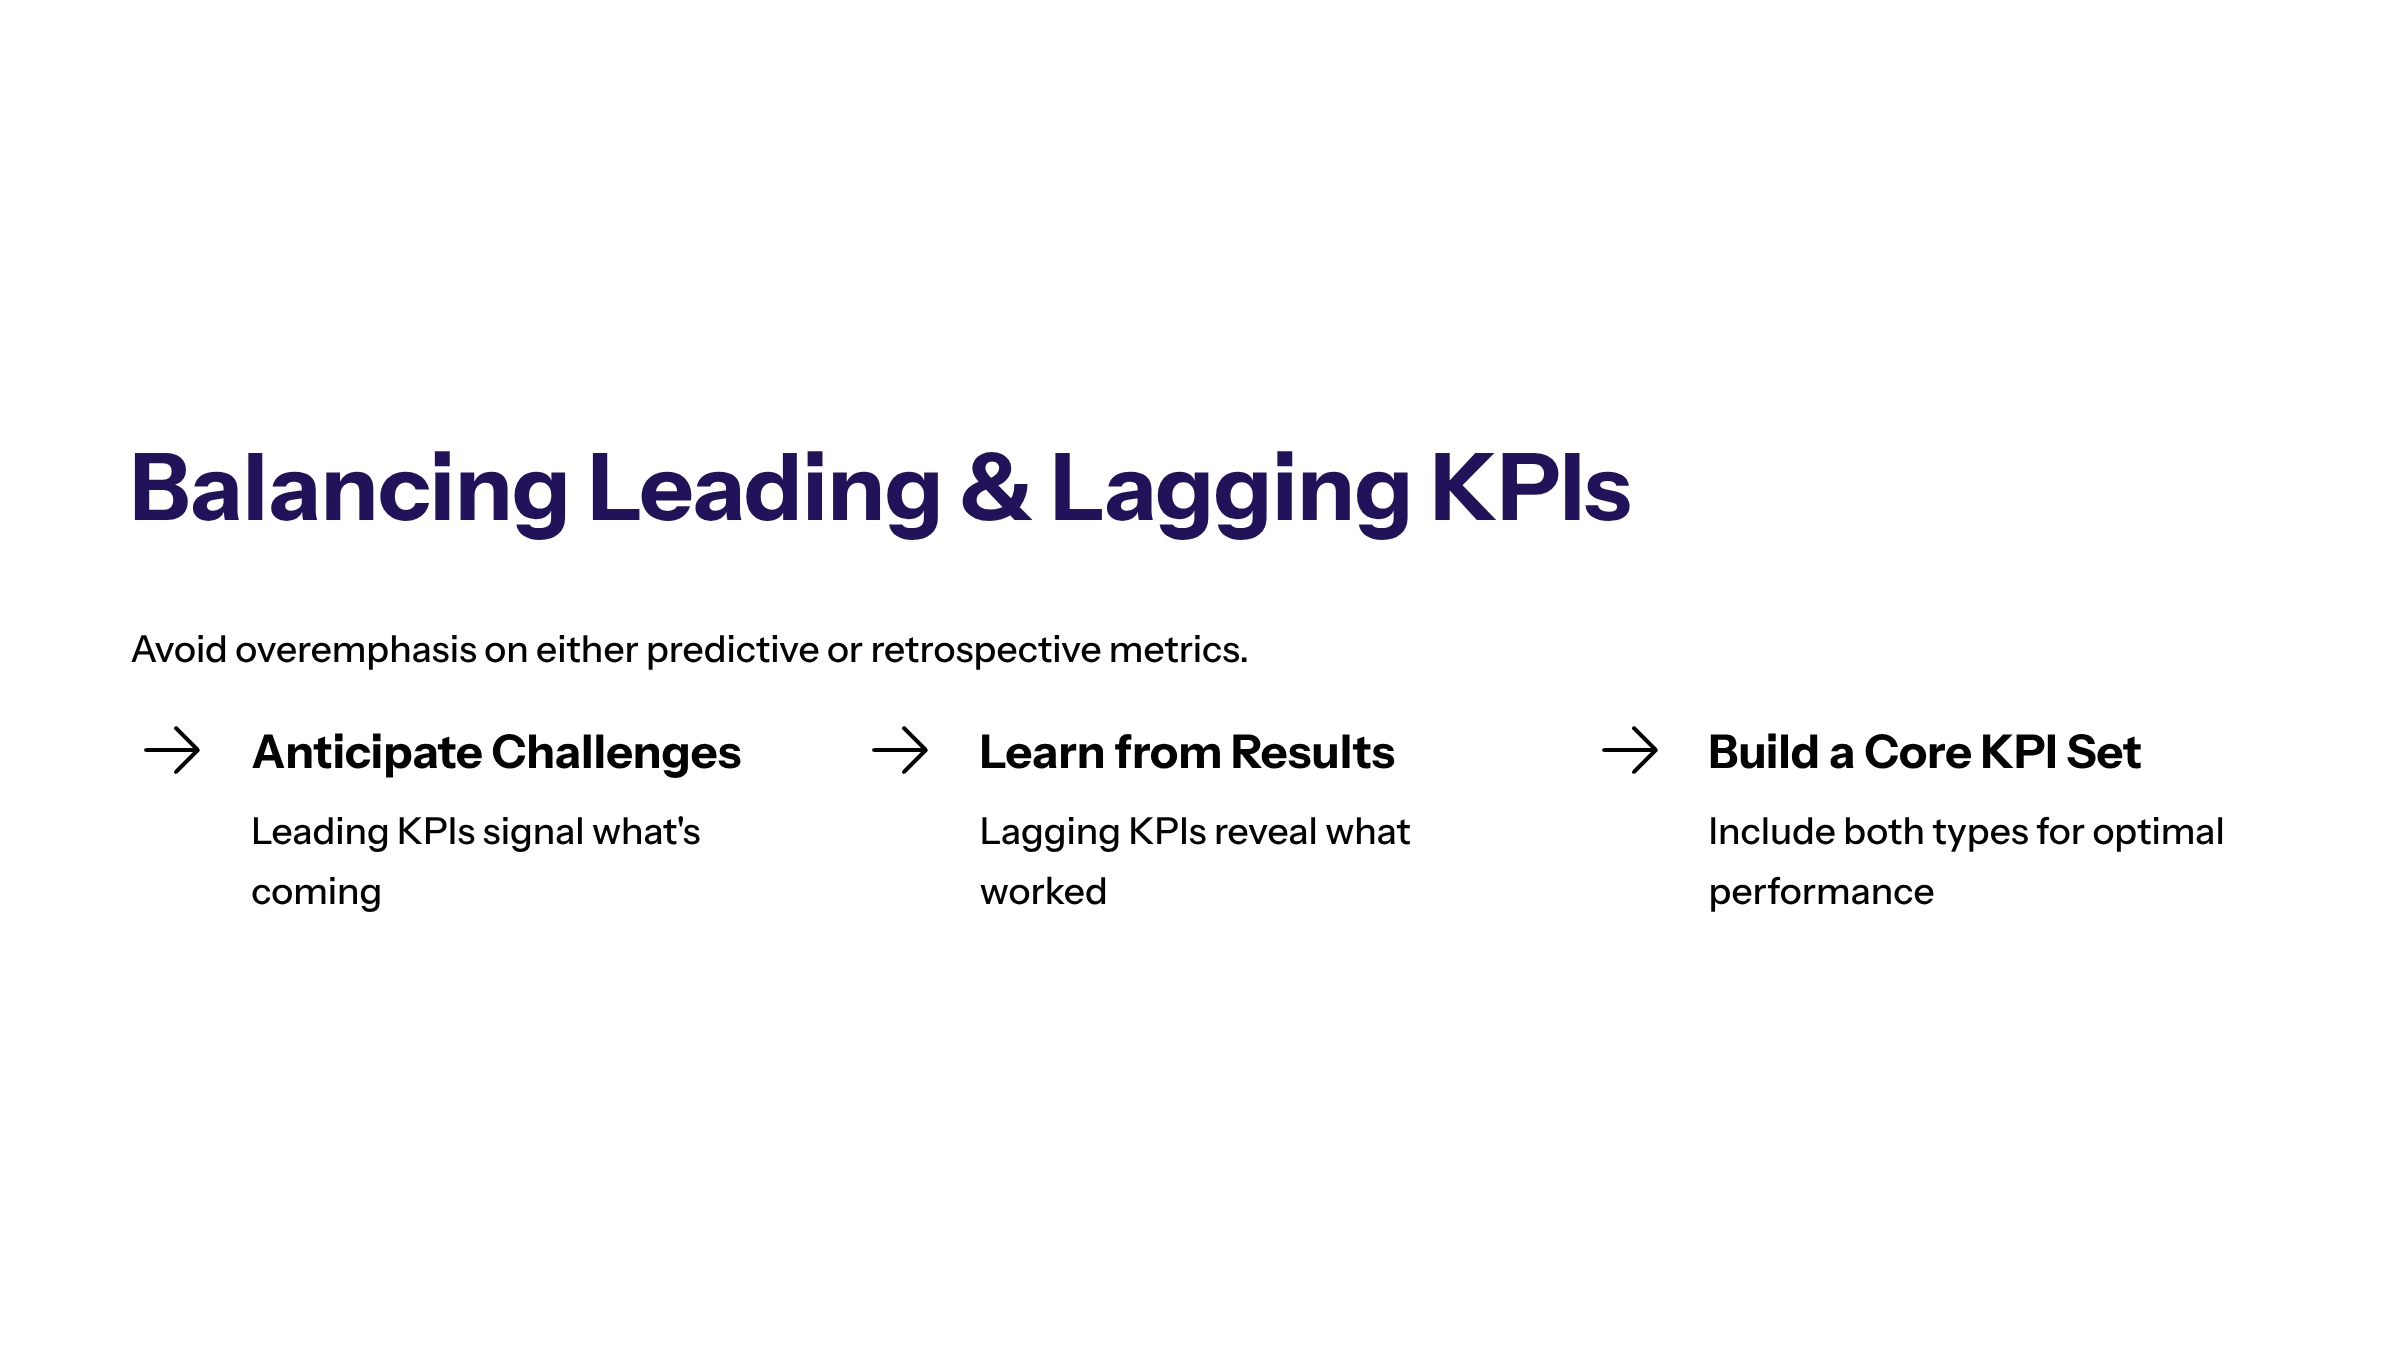
Balancing leading and lagging KPIs is essential to avoid overemphasis on either predictive or retrospective metrics. A well-balanced approach ensures organizations can anticipate challenges while learning from past results.
Strategies for Balancing KPIs
Identify a core set of KPIs that includes both leading and lagging indicators
Regularly assess the relevance and effectiveness of KPIs in reflecting business goals
Promote a culture that values both foresight and accountability
Use balanced KPIs to drive continuous improvement and strategic agility
Lagging Indicators: Examples and What They Measure
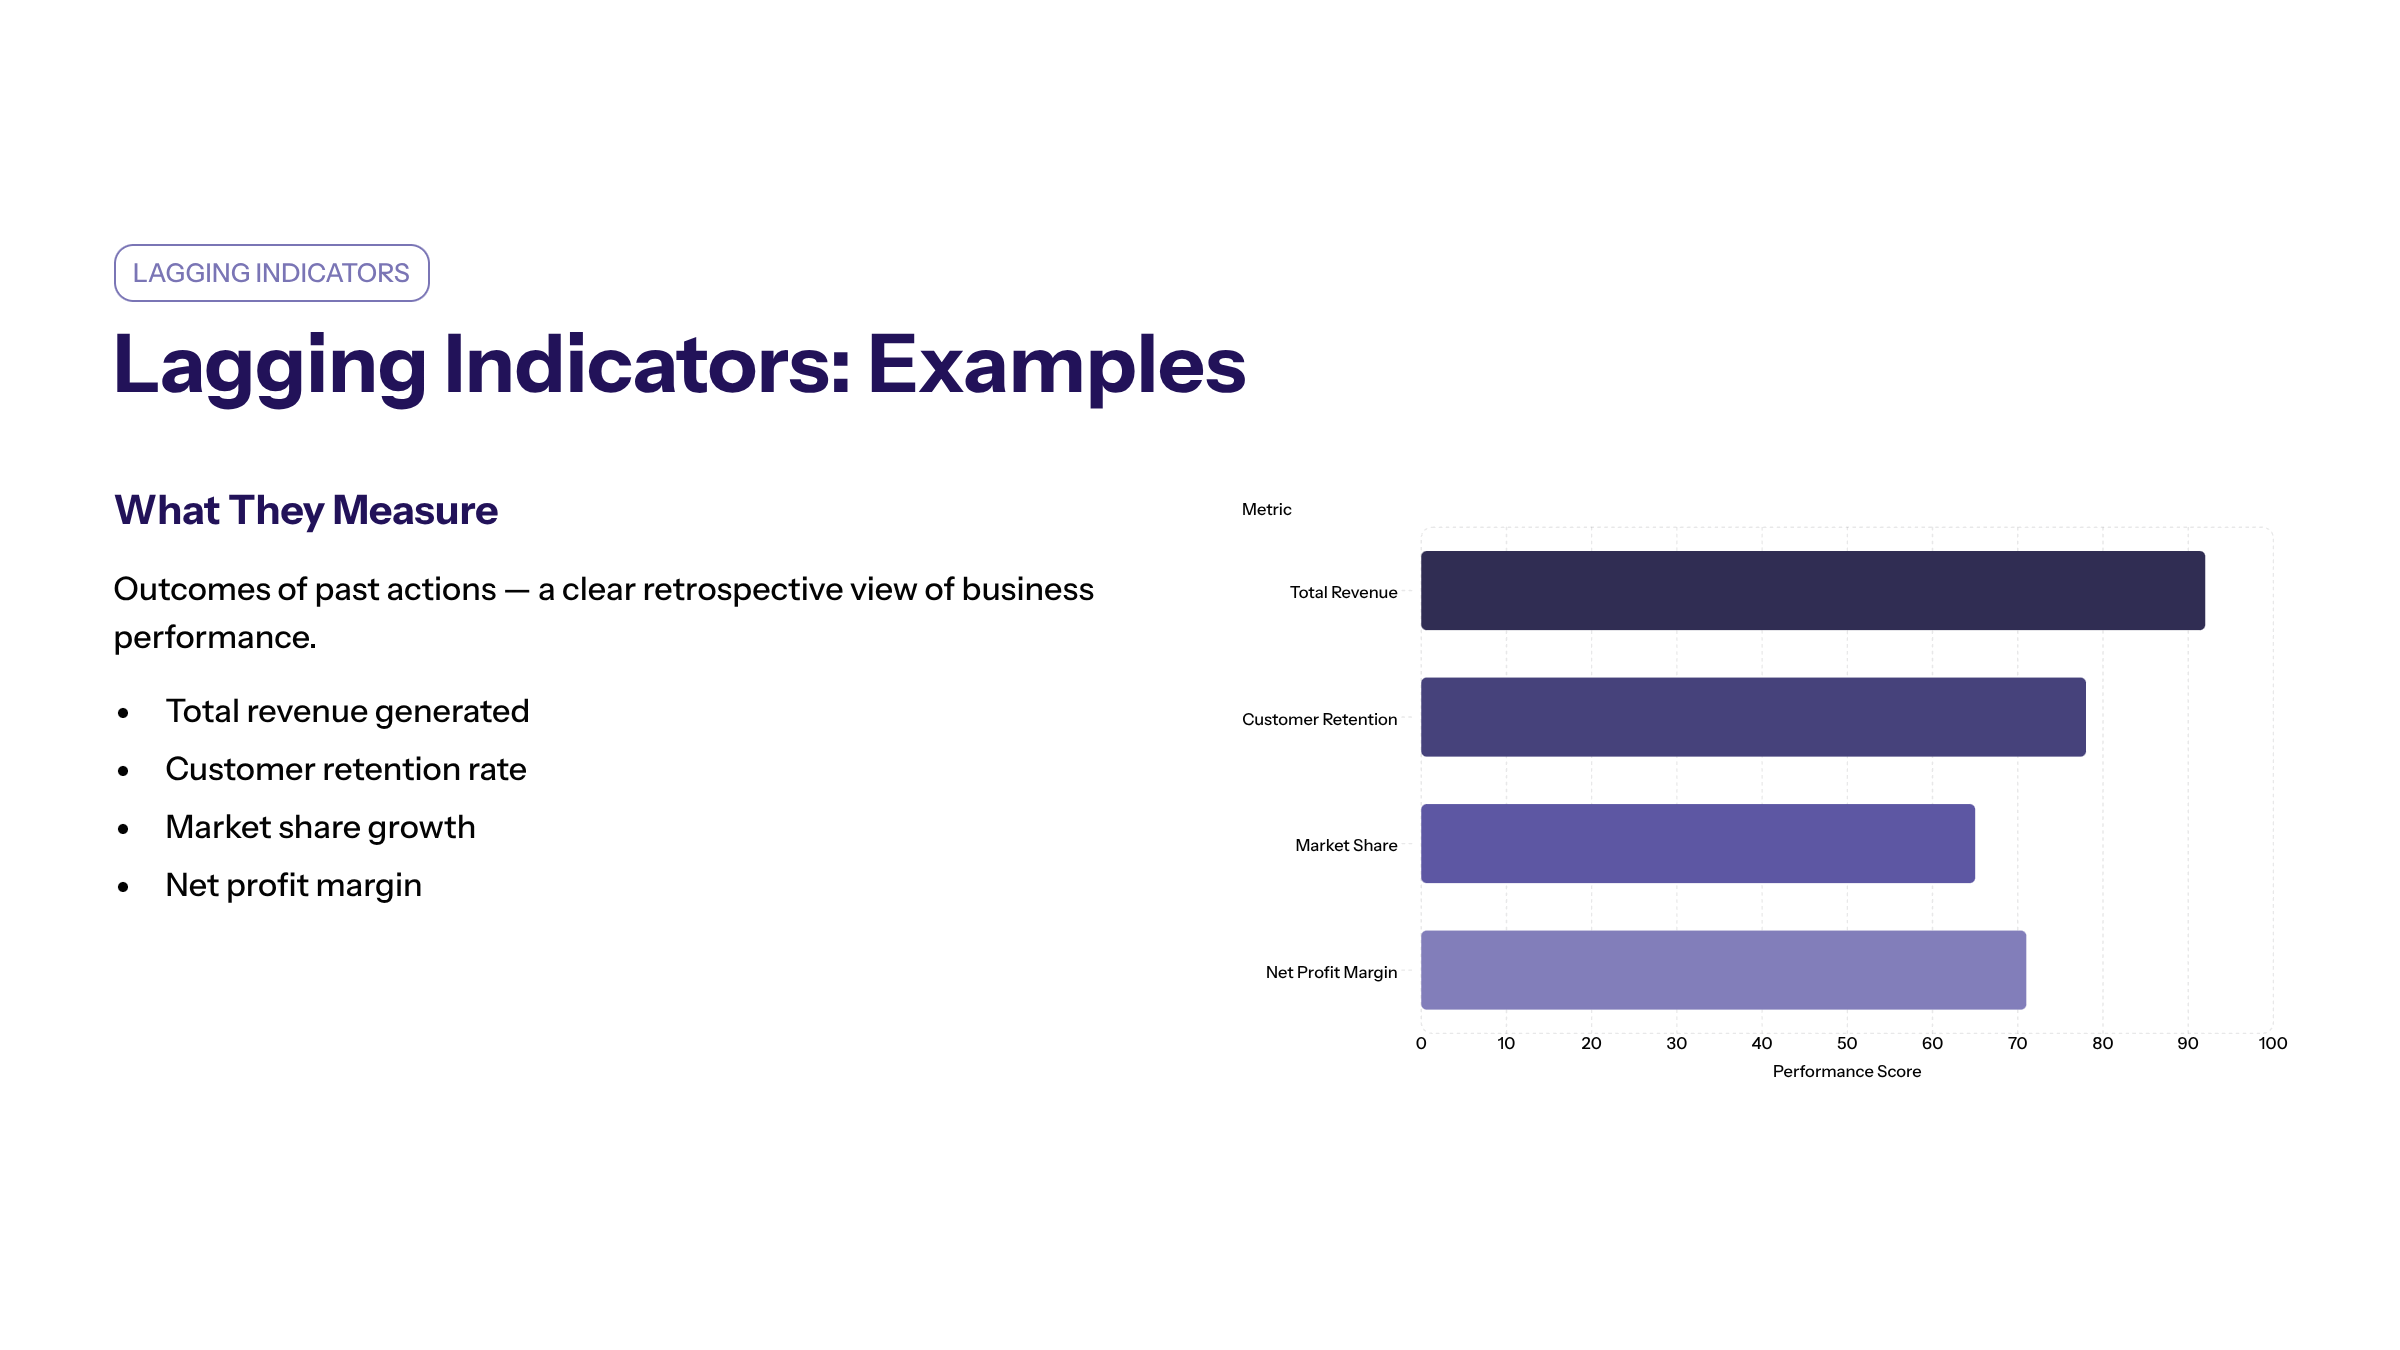
Lagging indicators measure the outcomes of past actions, providing a clear view of what has already transpired within a business. These key indicators are essential for evaluating the effectiveness of strategies and understanding overall business performance from a retrospective business perspective.
Common Lagging Indicators Examples
Total Revenue Generated: Reflects the overall financial performance of a company over a given period.
Customer Churn Rate: Measures the percentage of customers who stop using a product or service, indicating retention success.
Net Promoter Score (NPS): Gauges customer satisfaction and loyalty based on past interactions.
Profit Margins: Show the profitability of the business after accounting for costs.
Market Share: Indicates the company's position relative to competitors.
Average Revenue Per User (ARPU): Provides insight into the revenue generated per customer.
These lagging indicators measure the results of initiatives and are vital for accountability and lessons learned. However, they do not provide foresight into future performance, which is where leading indicators become crucial.
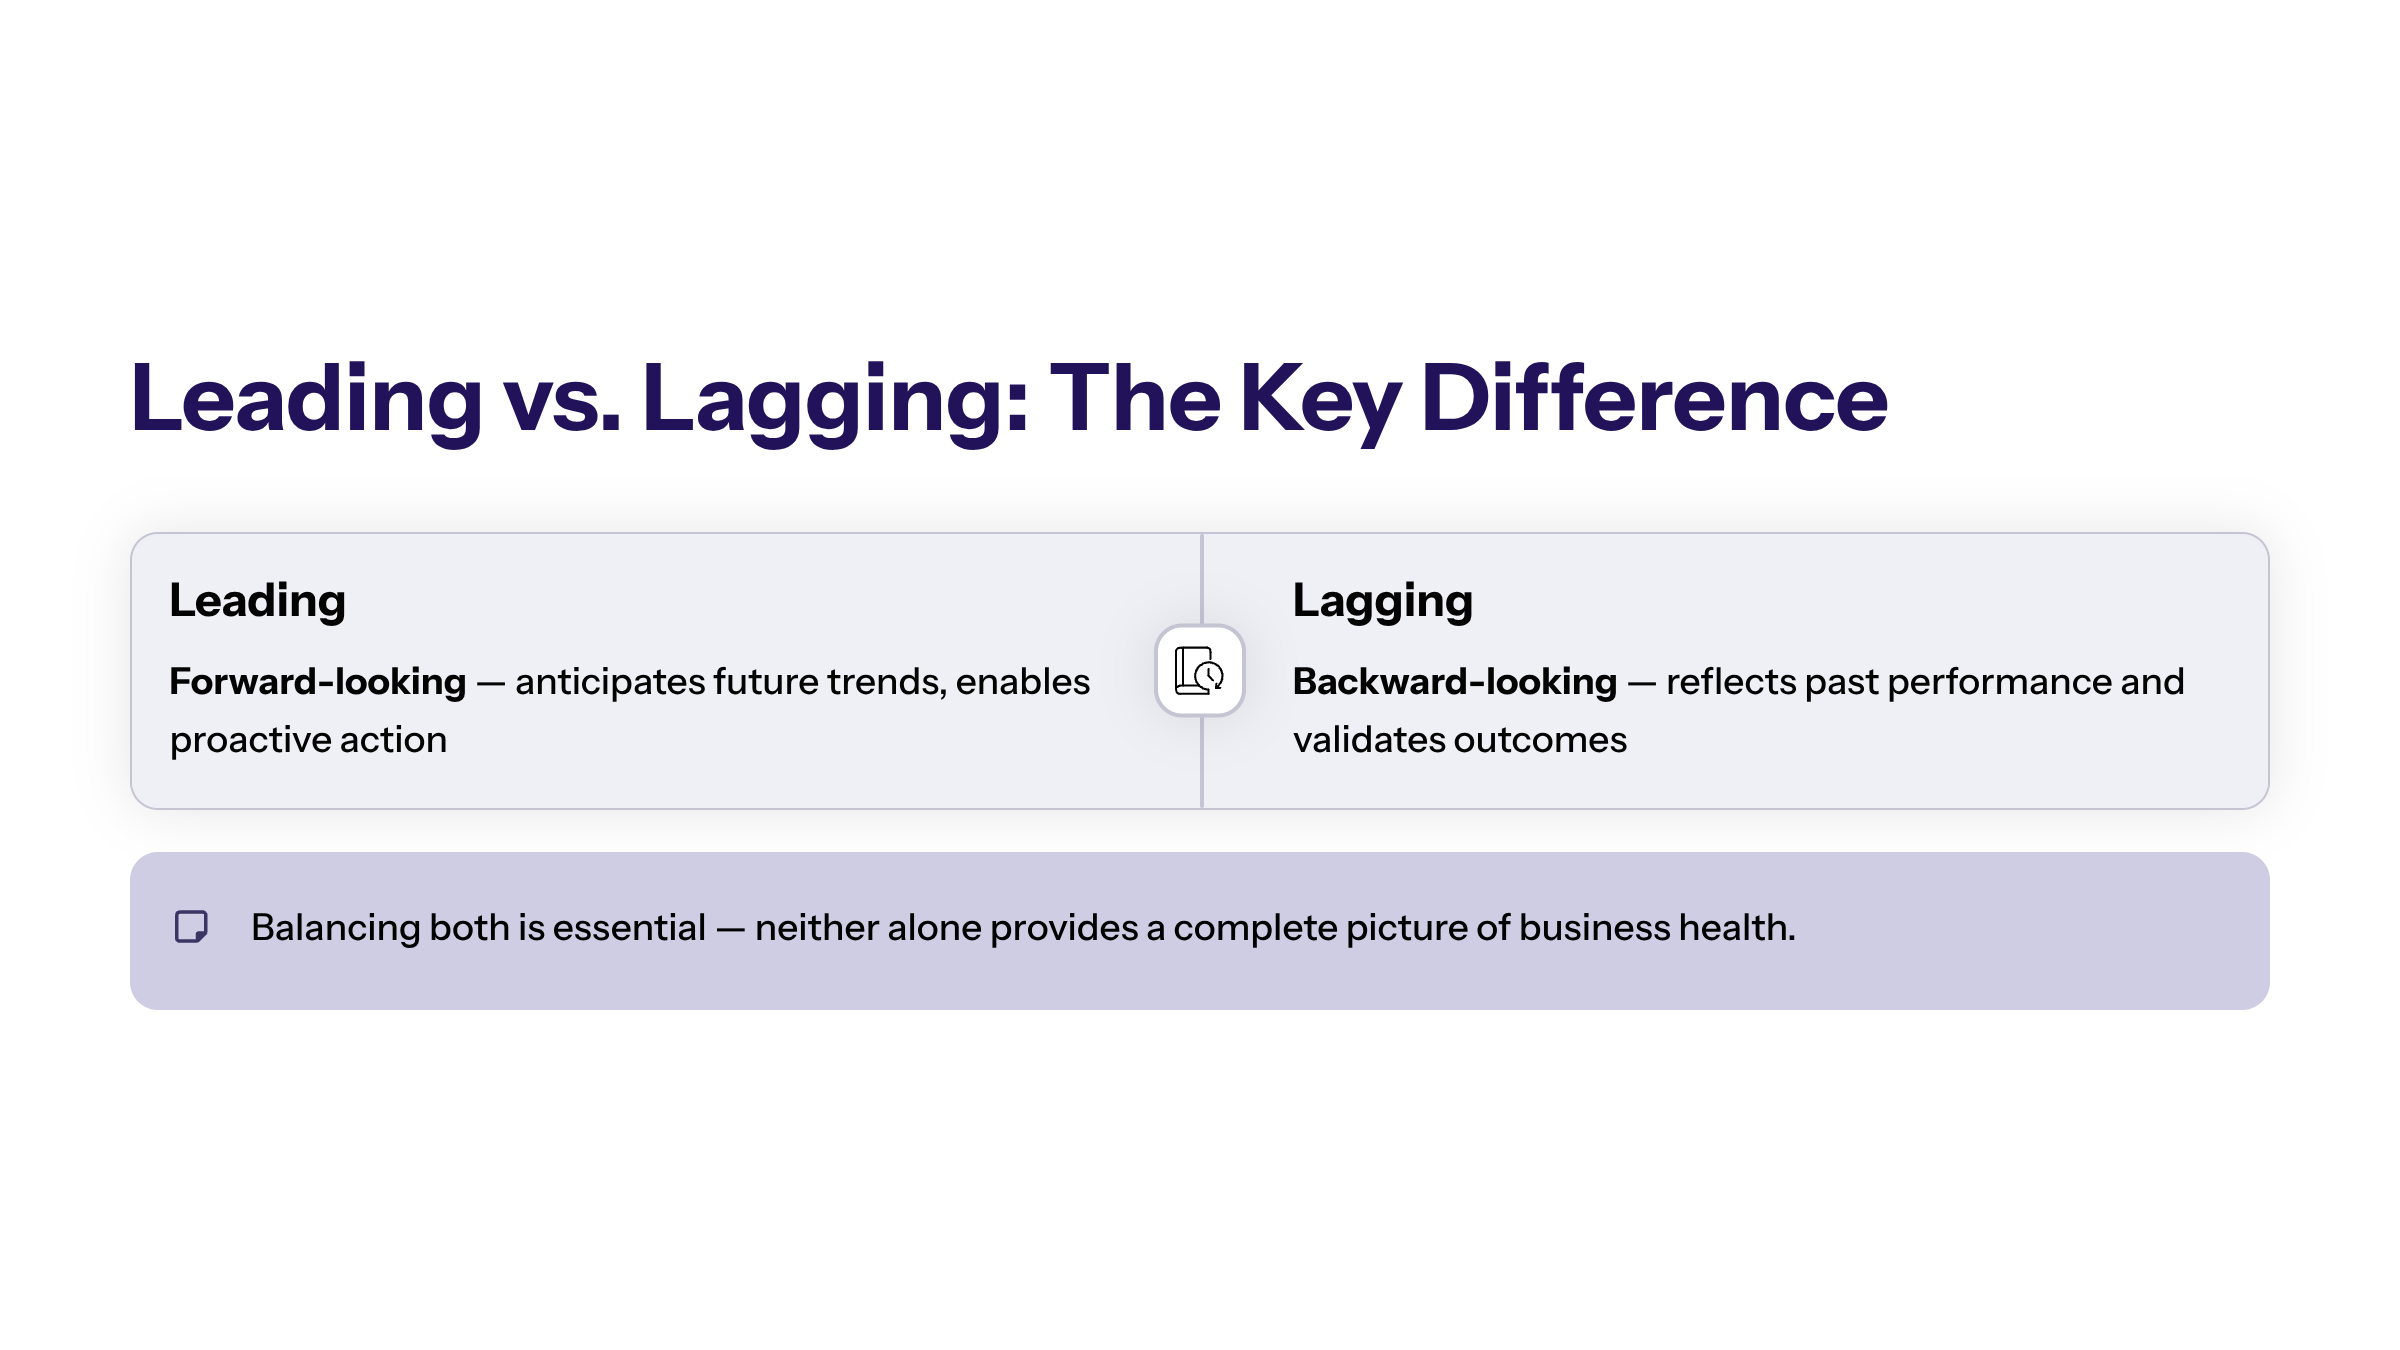
Leading vs Lagging Indicators: Understanding the Difference
The distinction between leading vs lagging indicators lies in their timing and predictive power. Leading indicators are forward-looking and help organizations anticipate future trends, while lagging indicators reflect past performance and outcomes.
Why Balance Leading and Lagging Indicators?
A balanced set of key metrics combining both leading and lagging indicators enables businesses to measure progress comprehensively. While lagging indicators validate results, leading indicators provide early warning signs and the necessary data to make proactive adjustments.
For example, in sales, potential sales in the pipeline (a leading indicator) can forecast future revenue, whereas total sales closed last quarter (a lagging indicator) confirms past success. This balance ultimately leads to better decision-making and positive outcomes.
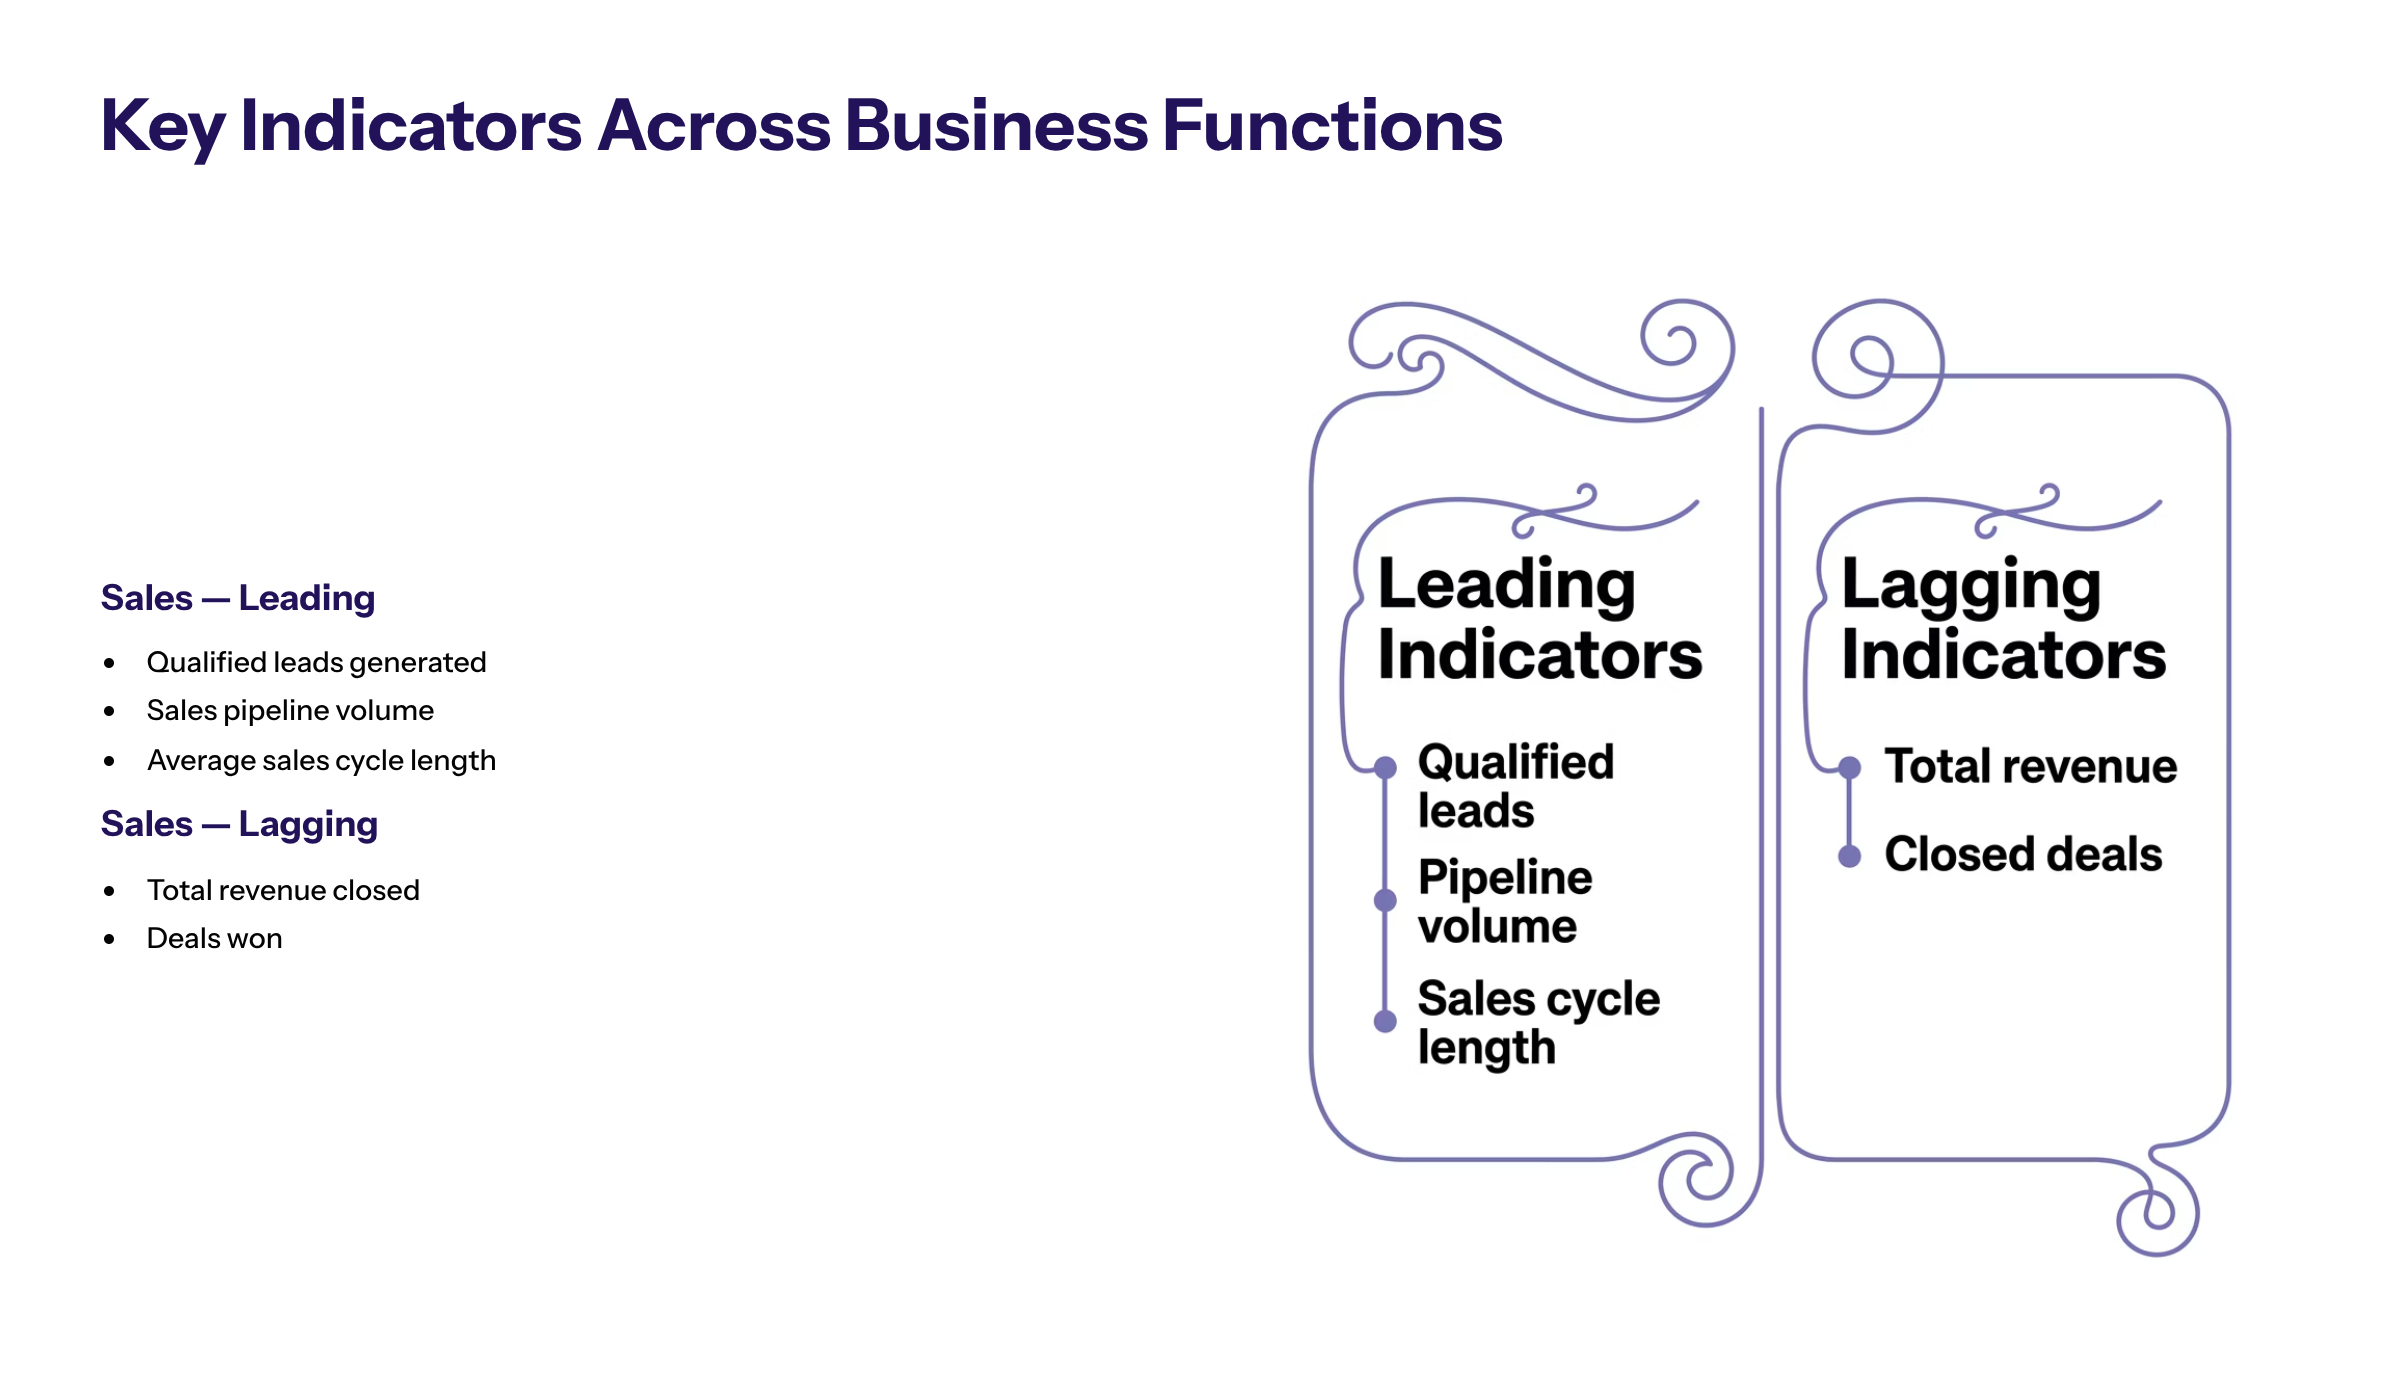
Key Indicators to Track Progress Across Business Functions
To effectively measure progress, organizations must identify and monitor various indicators tailored to their strategic goals.
Sales: Number of qualified leads, sales pipeline volume, and average sales cycle length are key leading indicators that predict potential sales. Lagging indicators include total revenue and closed deals.
Marketing: Website traffic, email open rates, and social media engagement serve as leading indicators, while conversion rates and customer acquisition cost are lagging metrics.
Customer Success: Customer satisfaction scores, onboarding completion rates, and product adoption rates are leading key indicators that forecast retention. Lagging indicators include churn rate and customer lifetime value.
Operations: Inventory turnover and production cycle time are leading indicators, with on-time delivery rates and product defect counts serving as lagging measures.
Tracking these key metrics allows businesses to monitor progress effectively and align efforts with desired outcomes.
The Role of Initial Contact and Customer Engagement in Predicting Success
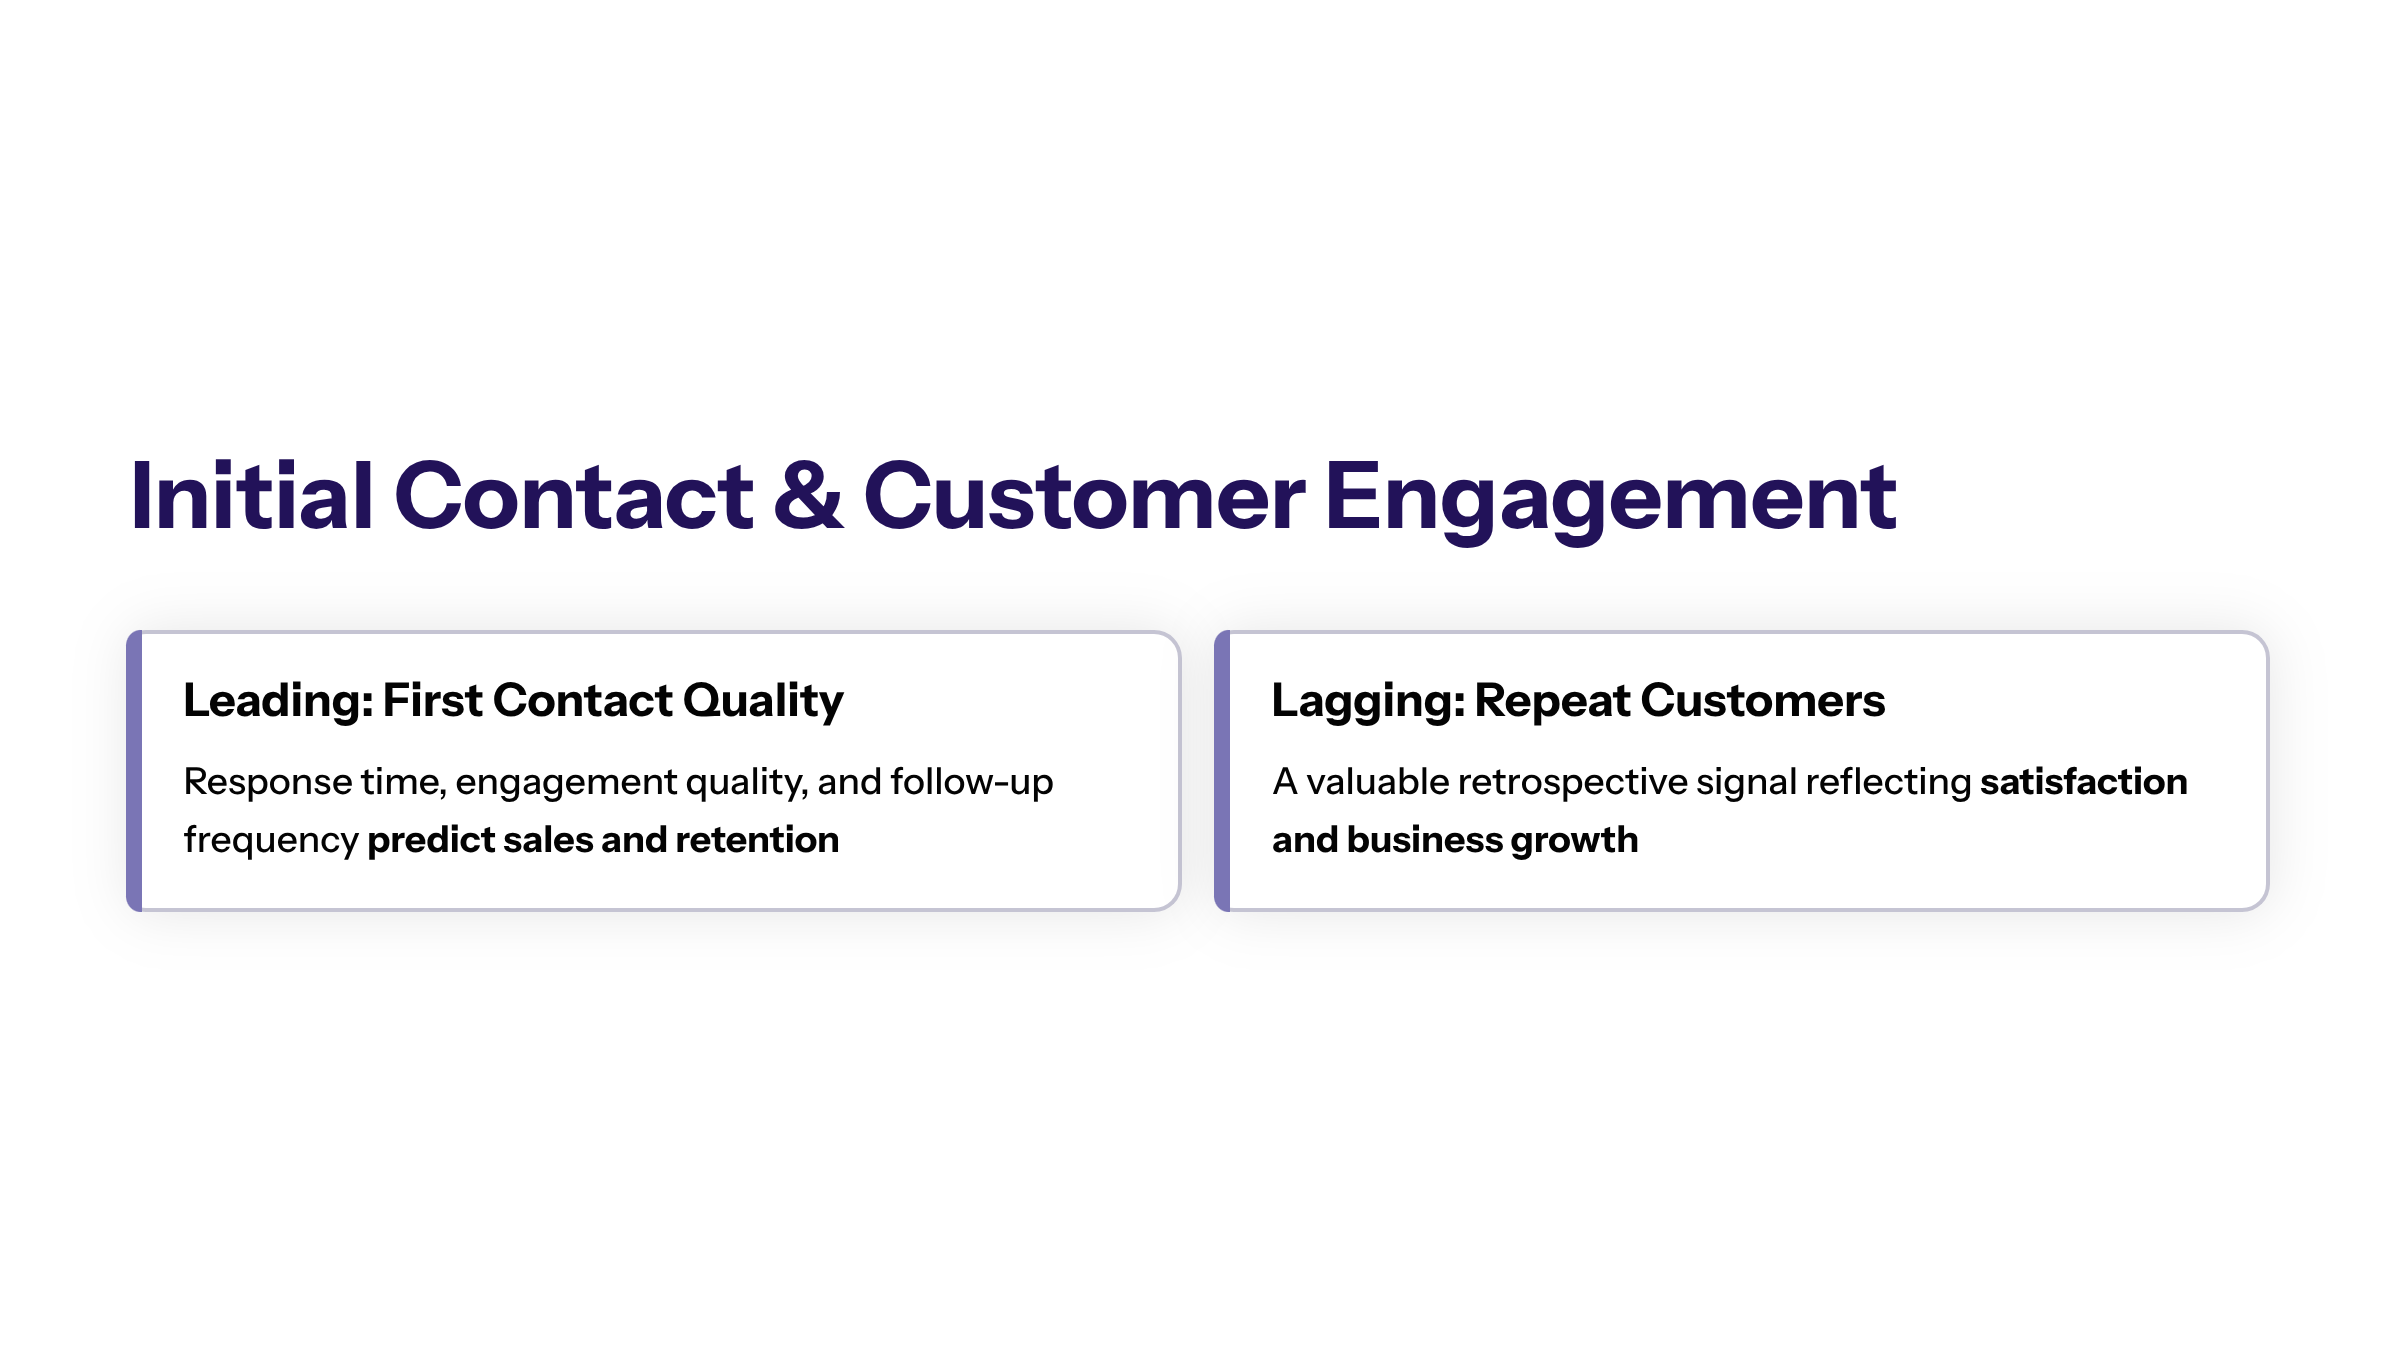
From a business perspective, the initial contact with a customer is a critical moment that can influence future success. Leading indicators related to initial contact, such as response time, quality of engagement, and follow-up frequency, can predict potential sales and customer retention.
Moreover, repeat customers are a valuable lagging indicator reflecting customer satisfaction and business growth. By analyzing the average number of repeat customers and their purchasing behavior, organizations can tailor strategies to enhance loyalty and lifetime value.
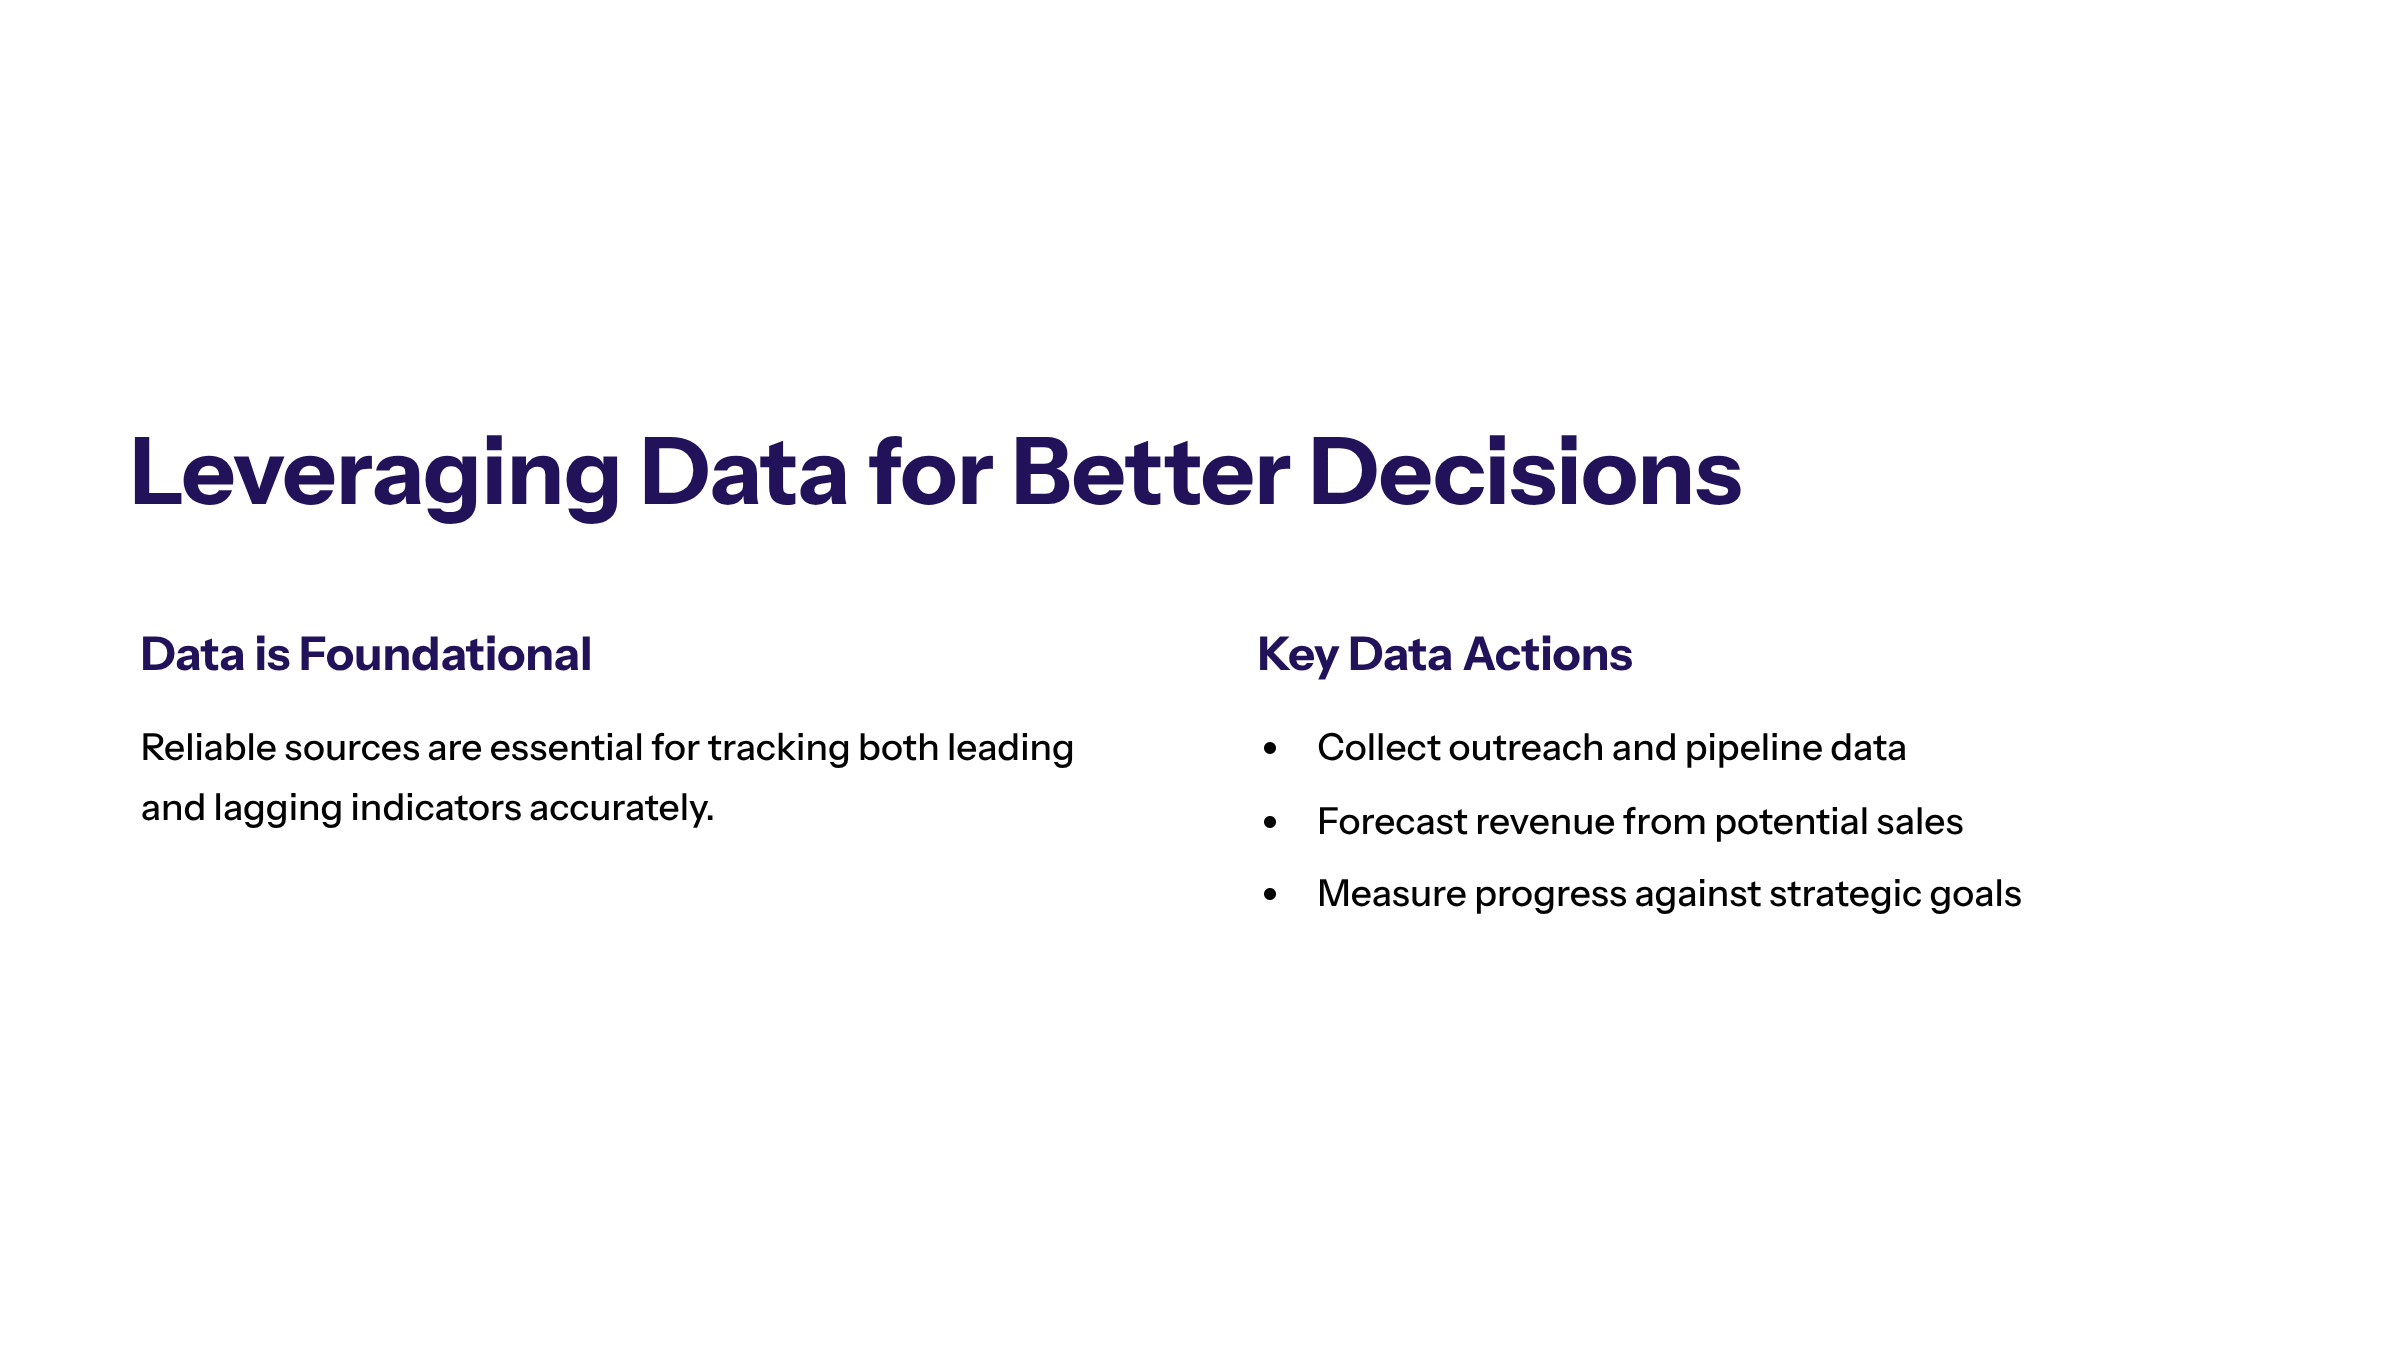
Leveraging Necessary Data to Enhance Decision-Making
Access to necessary data is fundamental in tracking both leading and lagging indicators. Businesses need reliable data sources to measure progress accurately and make informed decisions.
Collecting data on potential sales and outreach efforts helps forecast revenue.
Monitoring customer interactions and satisfaction provides insights into retention risks.
Analyzing average revenue per customer and sales cycle length informs resource allocation.
By integrating various indicators and necessary data, companies can develop a comprehensive view of performance and identify areas for improvement.
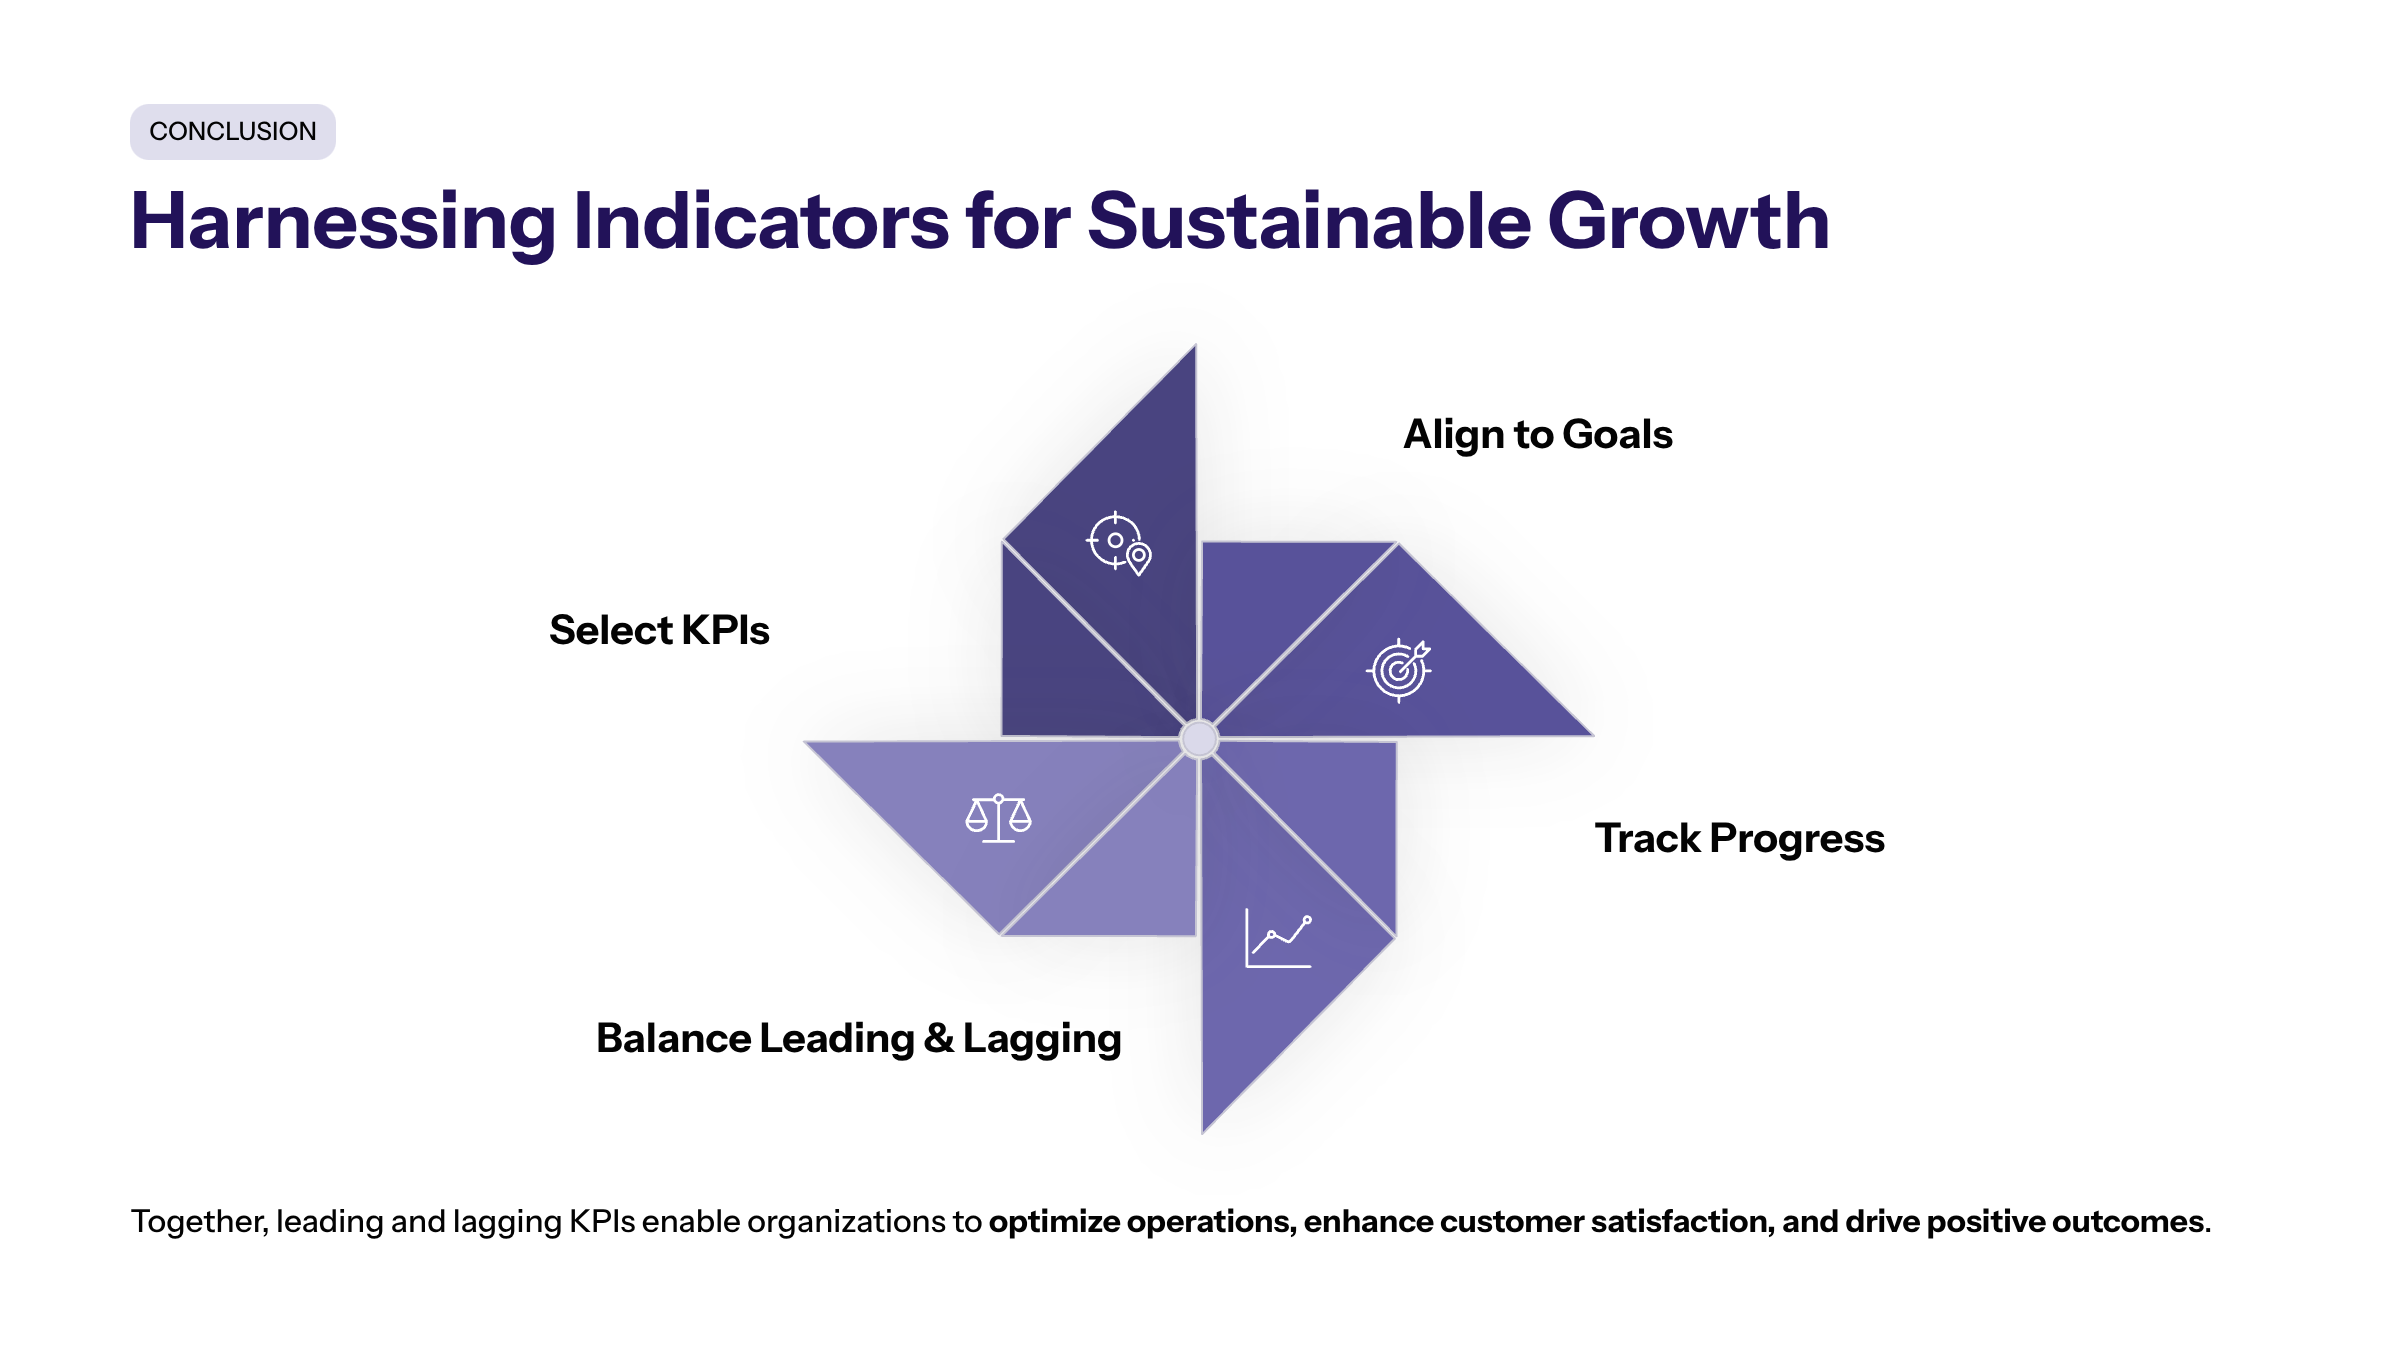
Harnessing Leading and Lagging Indicators for Sustainable Growth
In summary, understanding and utilizing both leading and lagging indicators is essential for effective performance management. Lagging indicators measure past outcomes and foster accountability, while leading indicators provide foresight and enable proactive adjustments.
By carefully selecting key indicators relevant to their business goals, tracking progress through necessary data, and balancing leading vs lagging KPIs, organizations can optimize operations, enhance customer satisfaction, and ultimately drive positive outcomes.
A strategic approach to these metrics empowers businesses to anticipate challenges, capitalize on opportunities, and sustain growth in a competitive marketplace. Embracing this comprehensive framework ensures that decision-makers have the insights needed to steer their organizations toward lasting success.