Top10 Workflow Adoption Metrics to Enhance Your Team’s Efficiency
Workflow adoption metrics are essential indicators that help organizations understand how effectively their teams are integrating new workflows and tools into daily operations.
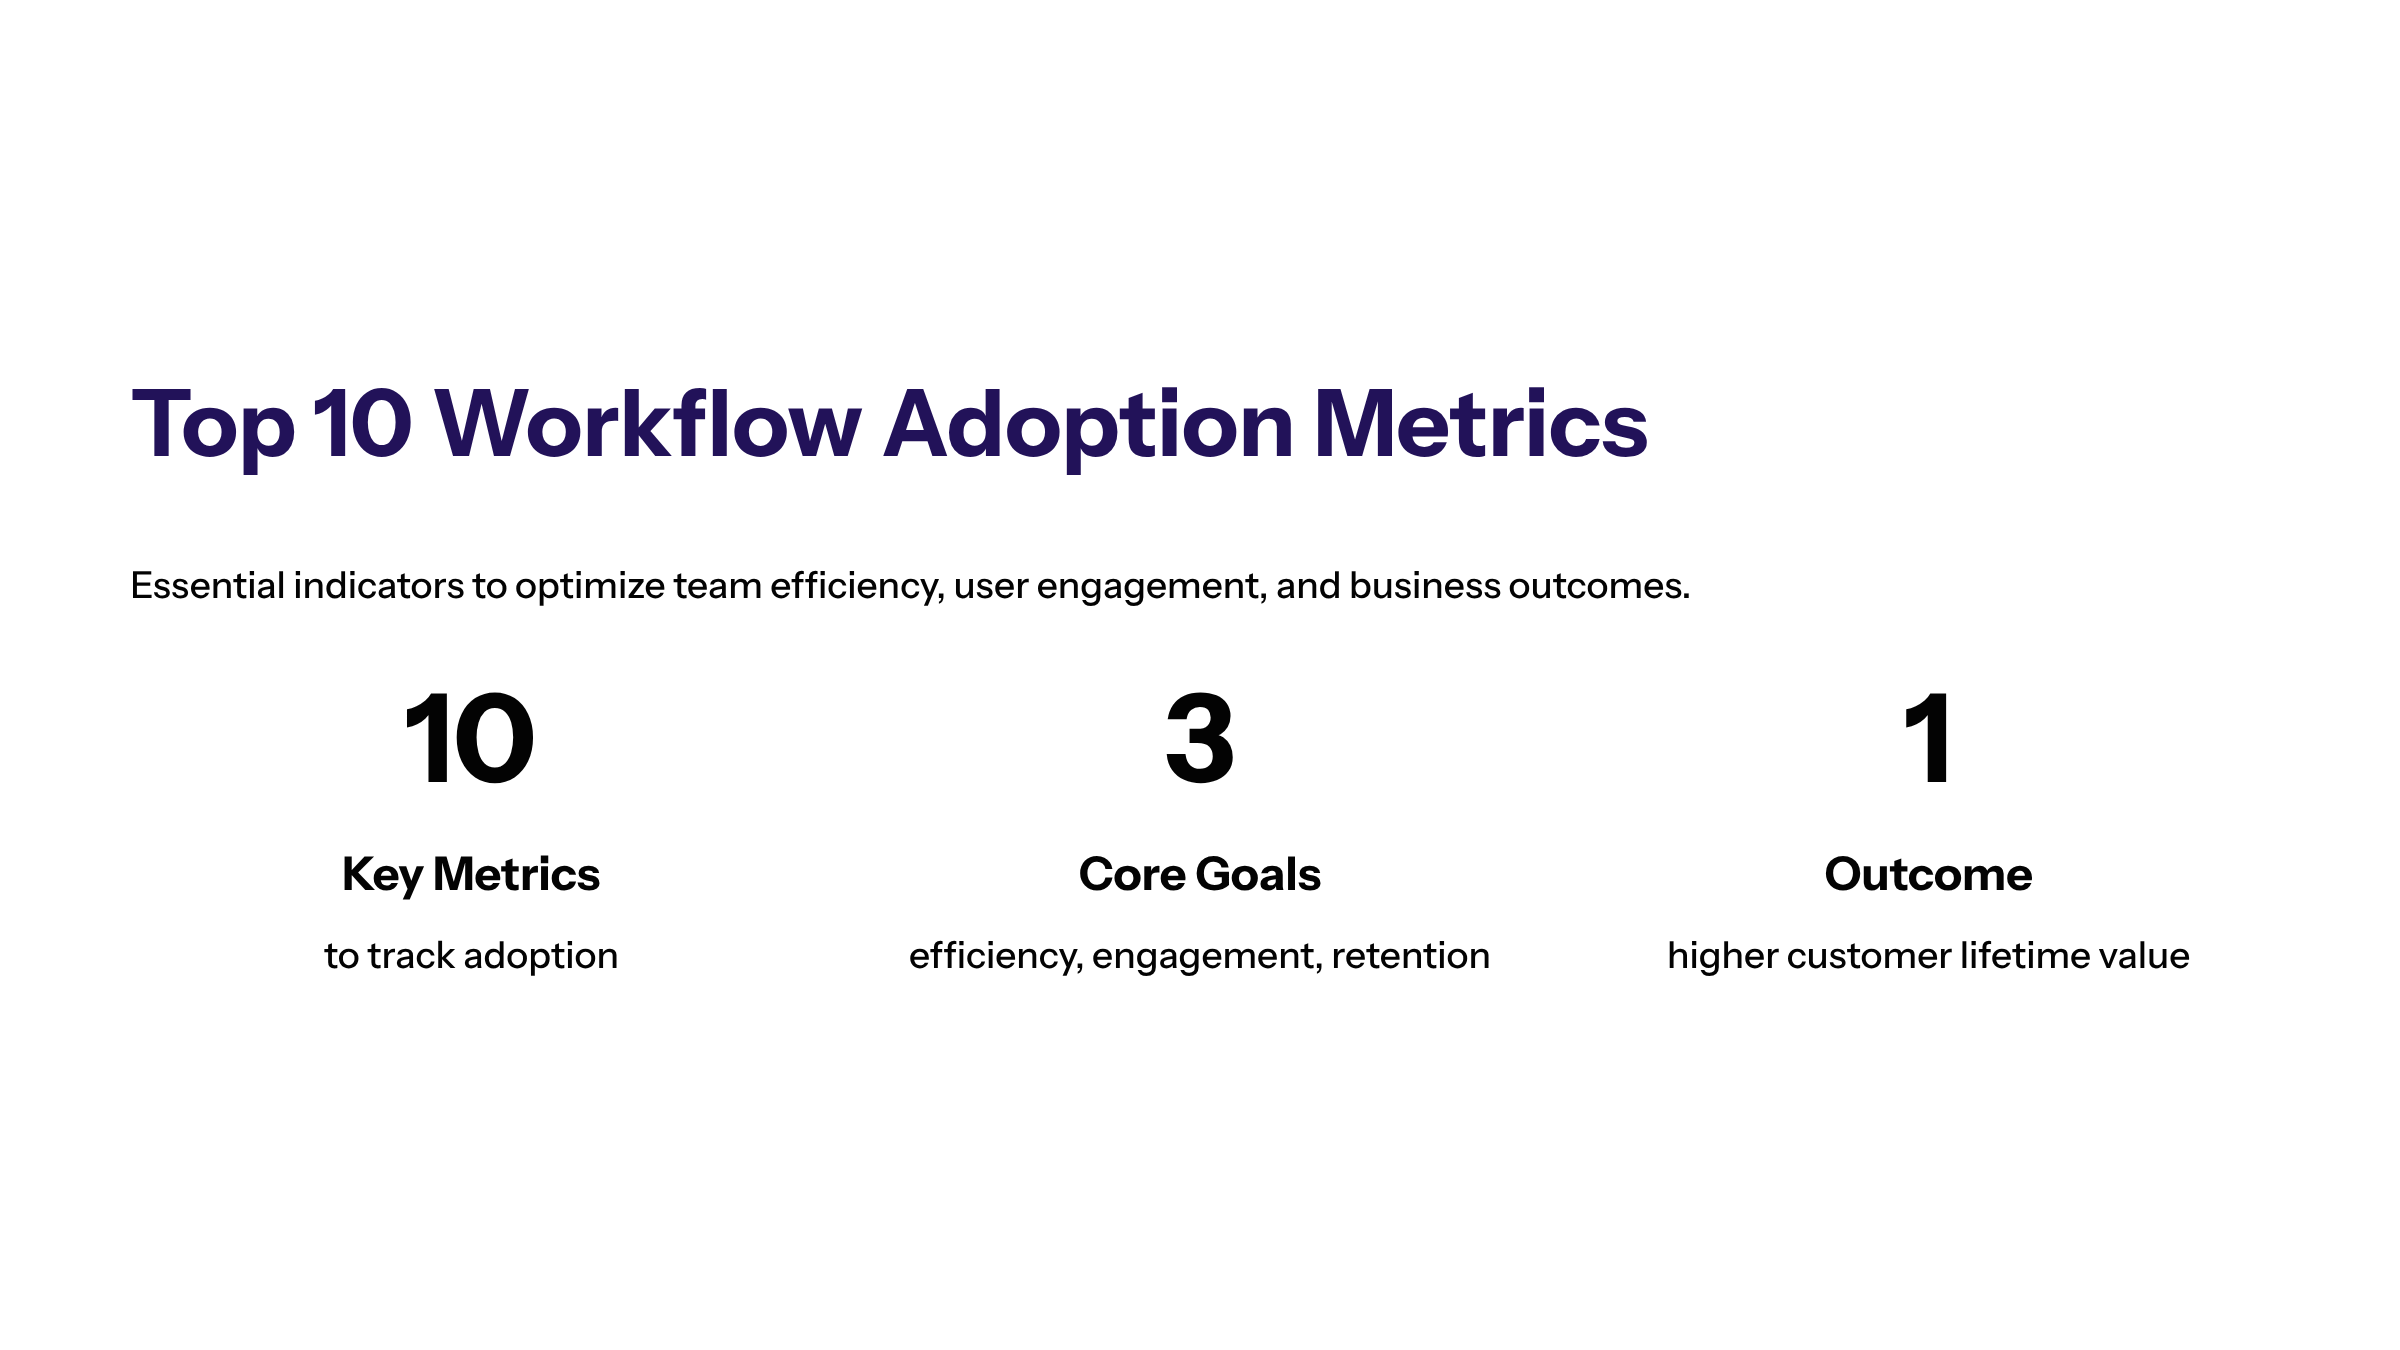
In this article, we explore the top 10 workflow adoption metrics that product managers and workflow managers should track to optimize team efficiency, user engagement, and overall business outcomes.
By leveraging these key product adoption metrics, organizations can identify bottlenecks, guide users through the adoption process, and ultimately improve user retention and customer lifetime value.
High user adoption, especially for customer-facing software, directly contributes to key revenue, growth, and loyalty outcomes. Monitoring these metrics ensures that workflows are not only implemented but embraced, driving sustained business success.
Key Takeaways:
Tracking the right workflow adoption metrics provides actionable insights into user behavior, enabling targeted improvements in onboarding, feature usage, and workflow design.
Metrics such as activation rate, feature adoption rate, and time-to-value reveal how quickly users realize workflow benefits and where users drop off, informing effective product strategy.
Combining quantitative data with qualitative user insights, such as user interviews and surveys, enhances understanding of user preferences and supports tailored adoption strategies.
Investing in Digital Adoption Platforms (DAPs) can streamline tracking, provide real-time user feedback, and enable role-based training to enhance adoption and user satisfaction.
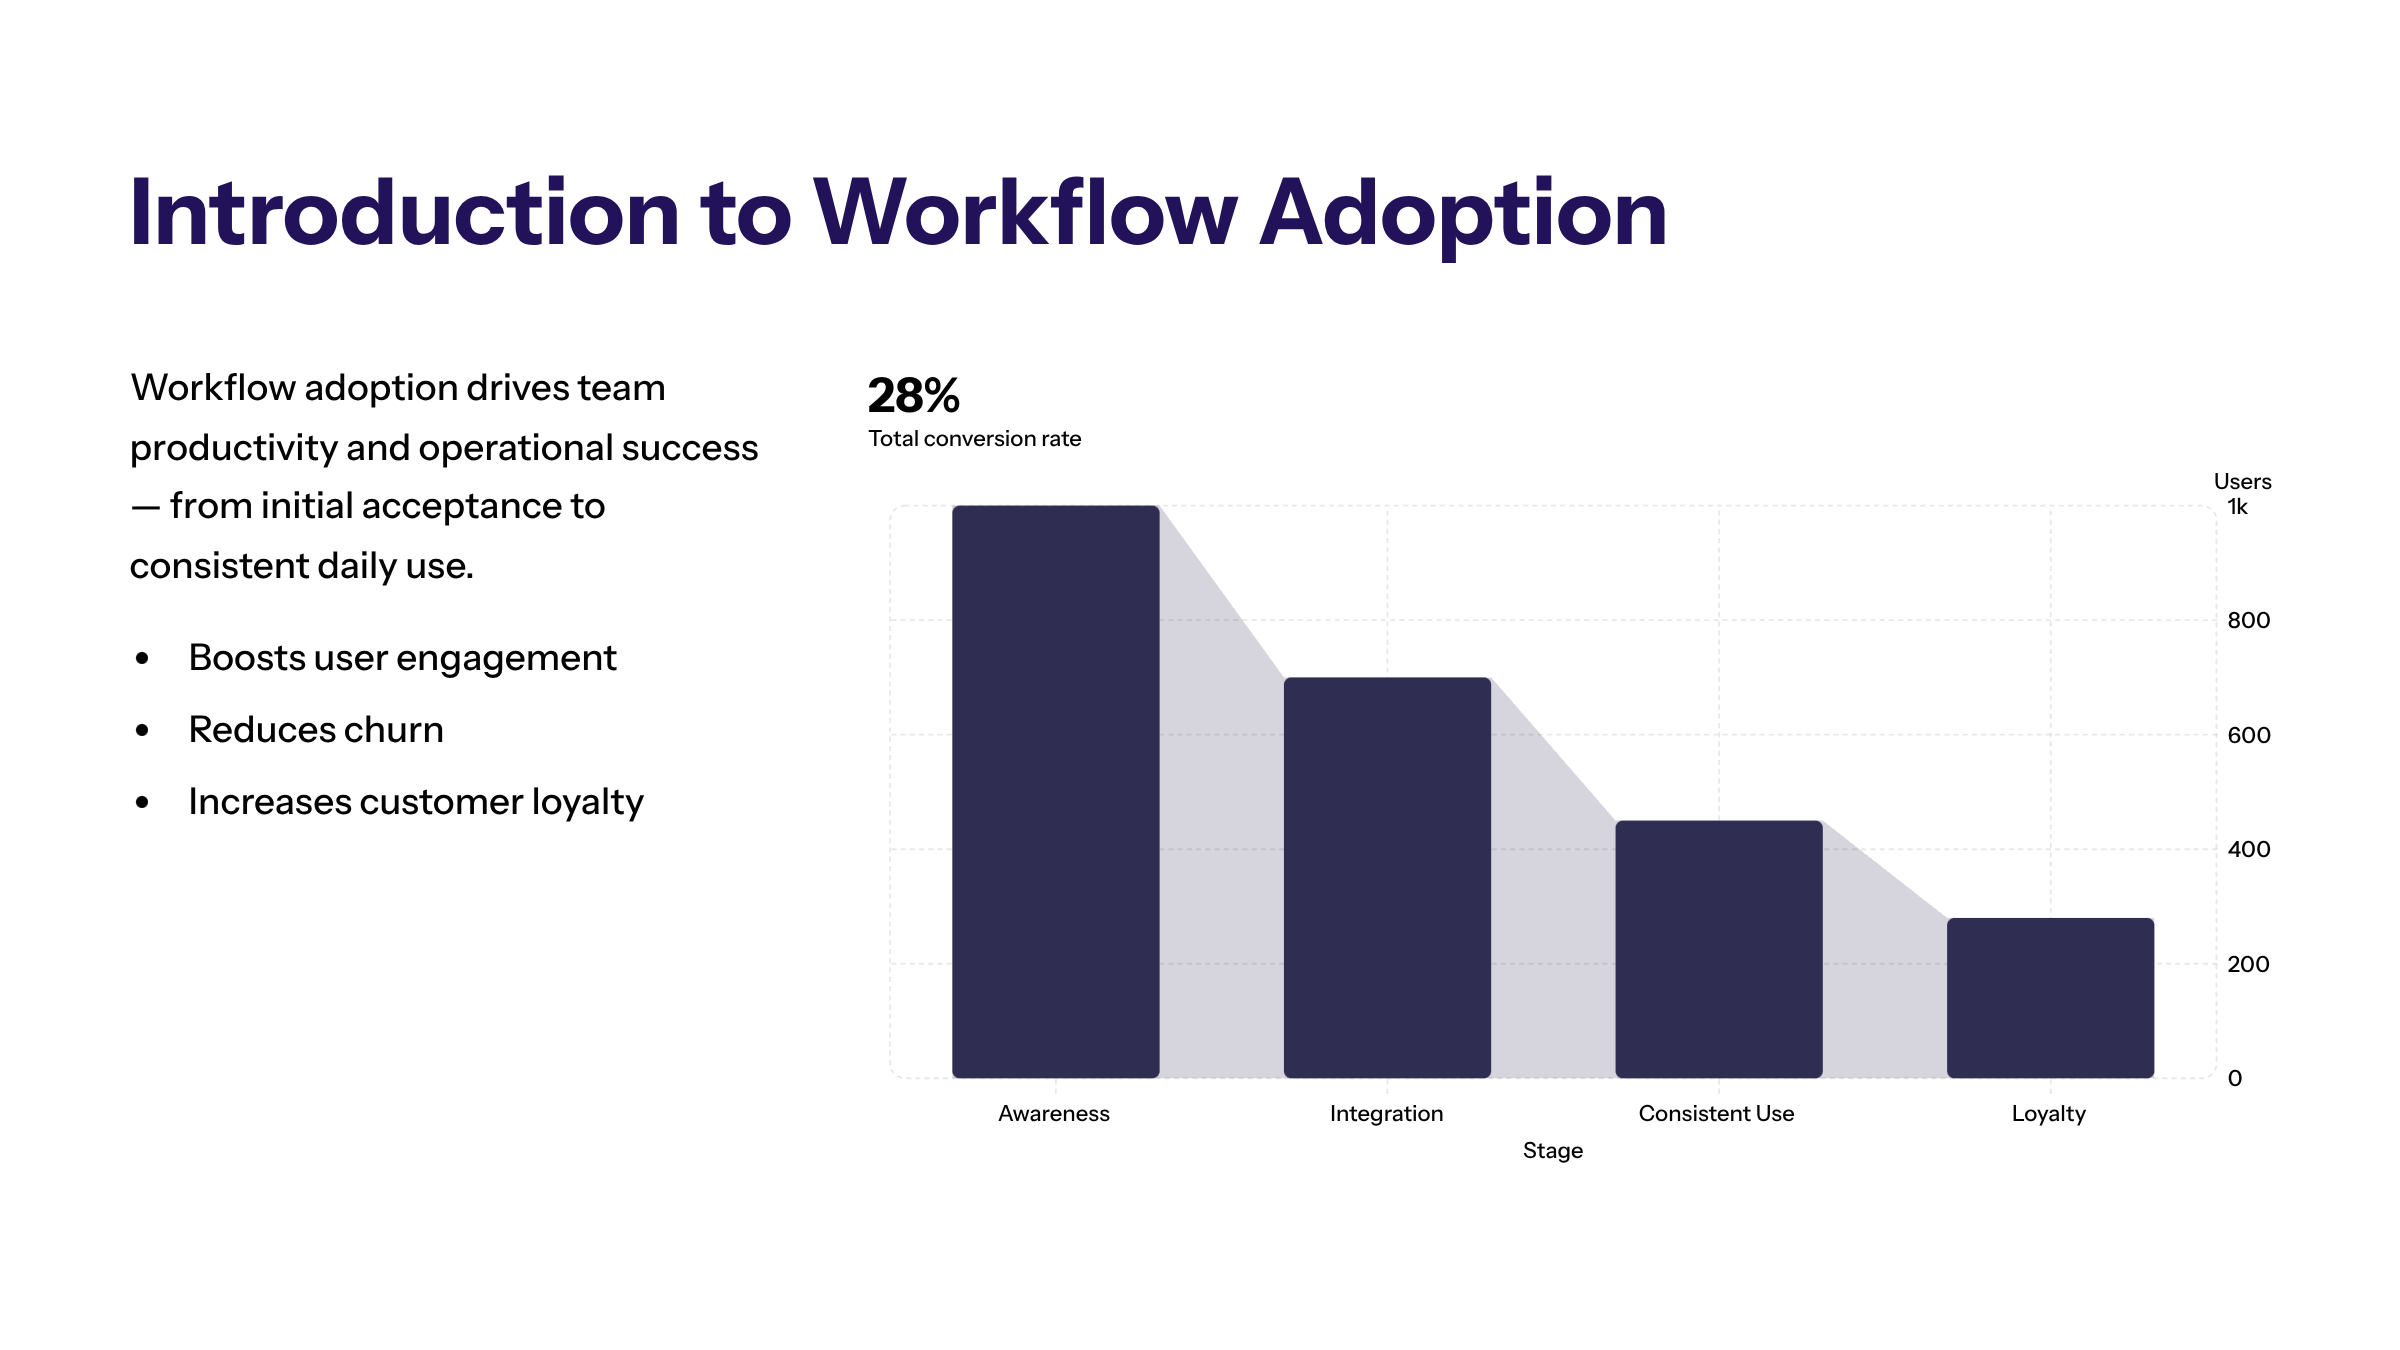
Introduction to Workflow Adoption
Workflow adoption is a critical factor influencing team productivity and operational success. It encompasses the process by which users accept, integrate, and consistently use new workflows or tools within their daily tasks. Effective workflow adoption not only boosts user engagement but also reduces churn and increases customer loyalty, contributing to sustained business growth.
High user adoption contributes significantly to revenue and growth, as engaged users are more likely to become loyal customers and advocates. Additionally, automation of administrative workflows can yield cost savings of up to 25%, further emphasizing the importance of successful adoption.
In today’s fast-paced digital environment, companies like Microsoft, Salesforce, and Atlassian emphasize the importance of monitoring workflow adoption metrics to ensure that new tools deliver ongoing value across different user groups. Understanding these metrics enables organizations to tailor onboarding processes, enhance core features, and align product strategy with user expectations.
Efficiency outcomes from well-adopted workflows include improvements in cycle time, reduction in error and revision rates, and better adherence to deadlines, all of which contribute to operational excellence.

Understanding User Adoption
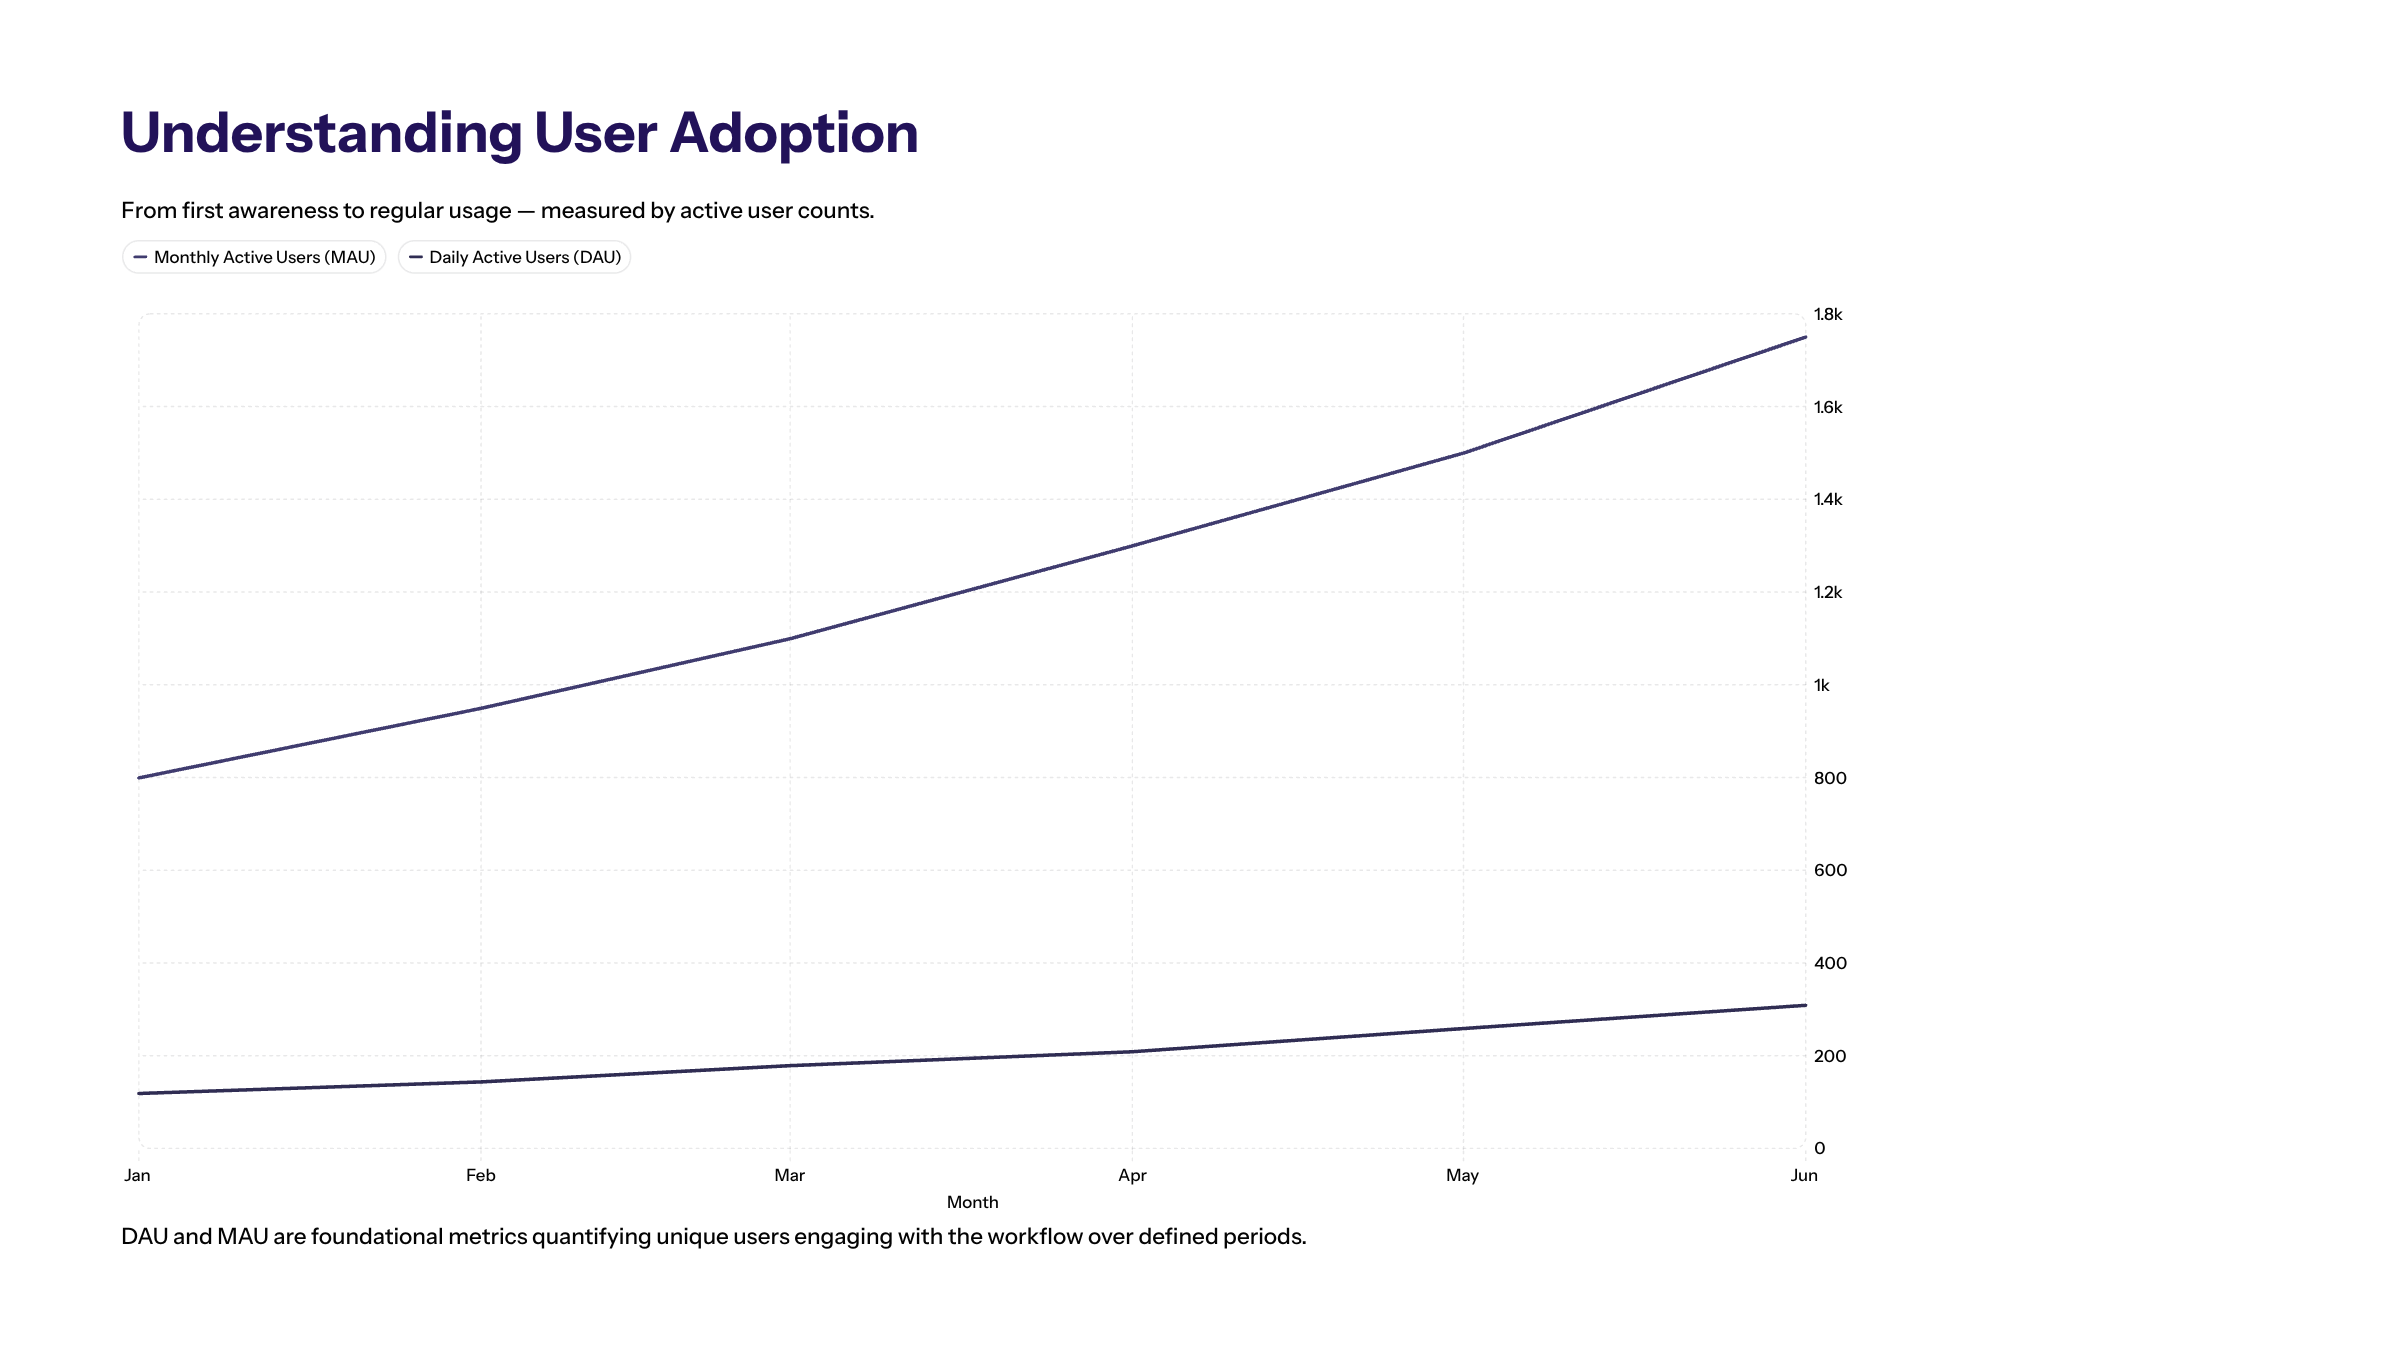
User adoption reflects how well users embrace new workflows, reflecting their journey from initial awareness to regular usage. User adoption metrics provide a window into user behavior, revealing how many users engage with the workflow, how frequently they return, and which features they utilize most.
User Engagement Metrics
Daily active users (DAU) and monthly active users (MAU) are foundational metrics that quantify unique users engaging with the workflow over defined periods. The DAU/MAU ratio, also known as stickiness, indicates how often users return, highlighting ongoing value or potential drop-off points.
A high stickiness ratio suggests a workflow that meets user needs consistently, while a low ratio signals opportunities to improve user engagement and retention.
“Understanding user engagement through DAU and MAU is fundamental for identifying active power users and tailoring experiences that boost long-term adoption,” says Jane Doe, Product Manager at Atlassian.
Tracking weekly active users further refines insights into user engagement patterns, revealing how often users interact with workflows on a more granular level.
Measuring Workflow Adoption
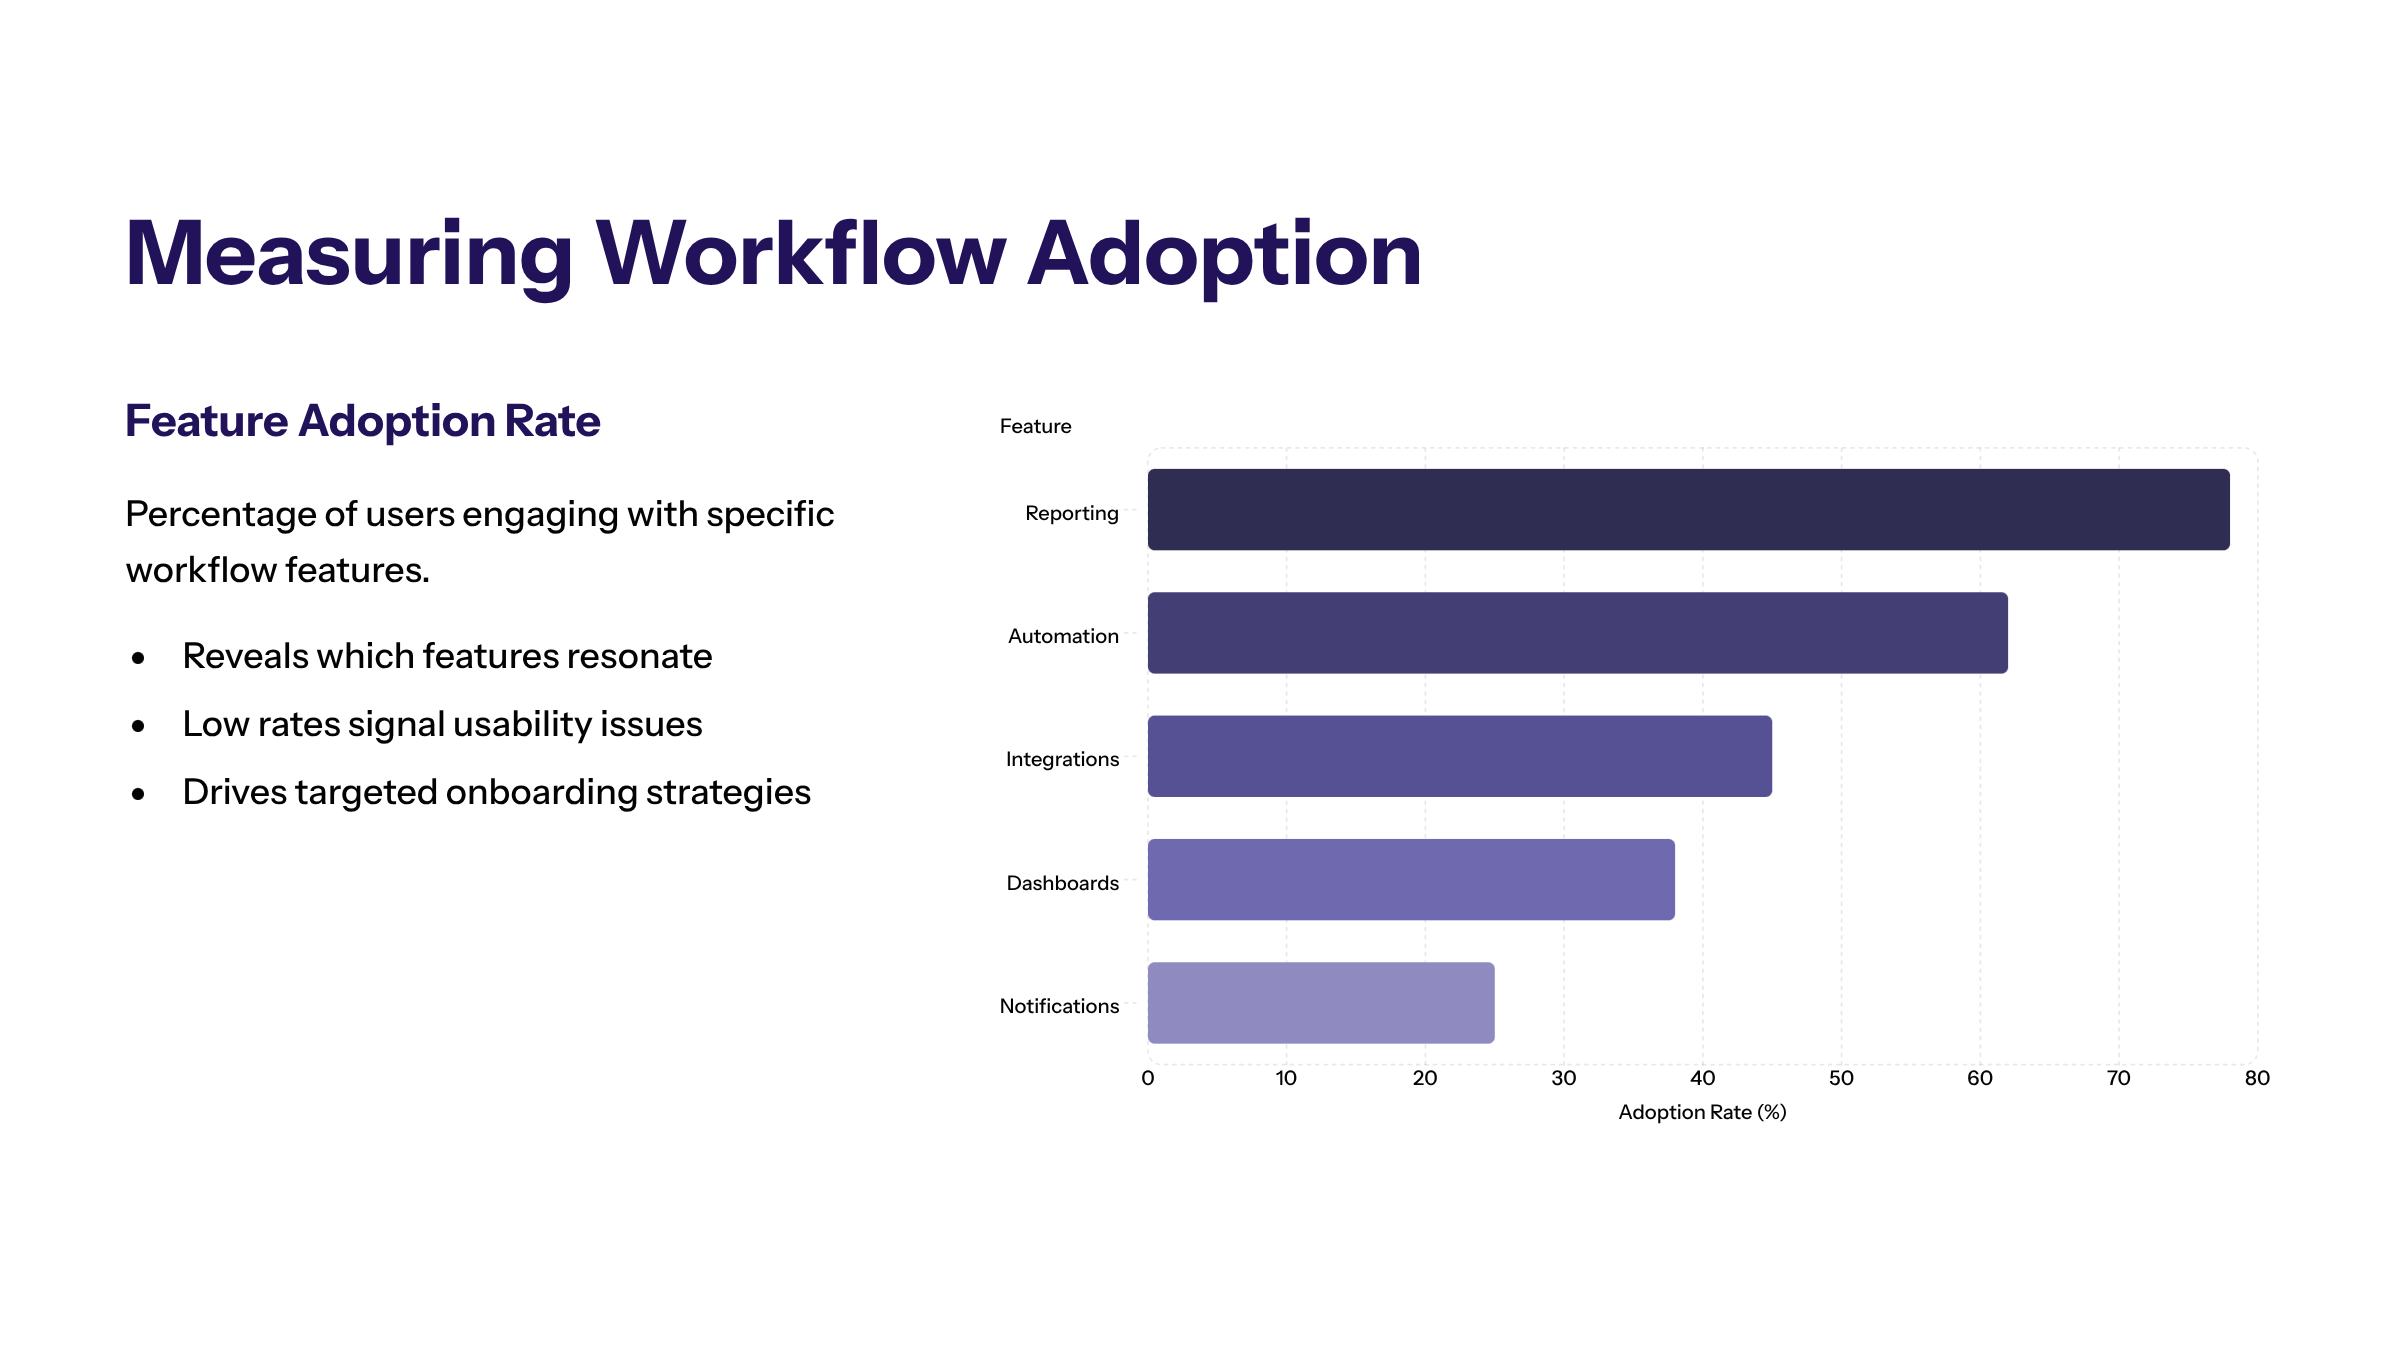
Feature Adoption and Product Adoption Metrics
Feature adoption rate measures the percentage of users engaging with specific workflow features, providing insights into which key features resonate and which may require refinement. Low feature adoption rates often indicate usability issues or lack of awareness, necessitating targeted onboarding and communication strategies.
Product adoption metrics such as activation rate and time-to-value (TTV) track how quickly users reach meaningful milestones, reflecting the effectiveness of the onboarding process and the workflow’s ability to deliver core value promptly.
Metric | Definition | Importance | Calculation Example |
|---|---|---|---|
Activation Rate | % of new users completing key actions | Indicates onboarding success | (Users completing activation / New users) x 100 |
Feature Adoption Rate | % of users using a specific feature | Reveals feature engagement | (Users using feature / Total active users) x 100 |
Time-to-Value (TTV) | Time taken to reach a core workflow milestone | Measures speed of user value realization | Average time from signup to milestone |
A shorter TTV suggests that users quickly find the product beneficial, which correlates with higher user satisfaction and retention. Conversely, a prolonged TTV may indicate onboarding inefficiencies or unclear value propositions.
According to a study by Product School, workflows with shorter TTV demonstrate higher user retention and satisfaction, underscoring the need for streamlined onboarding.
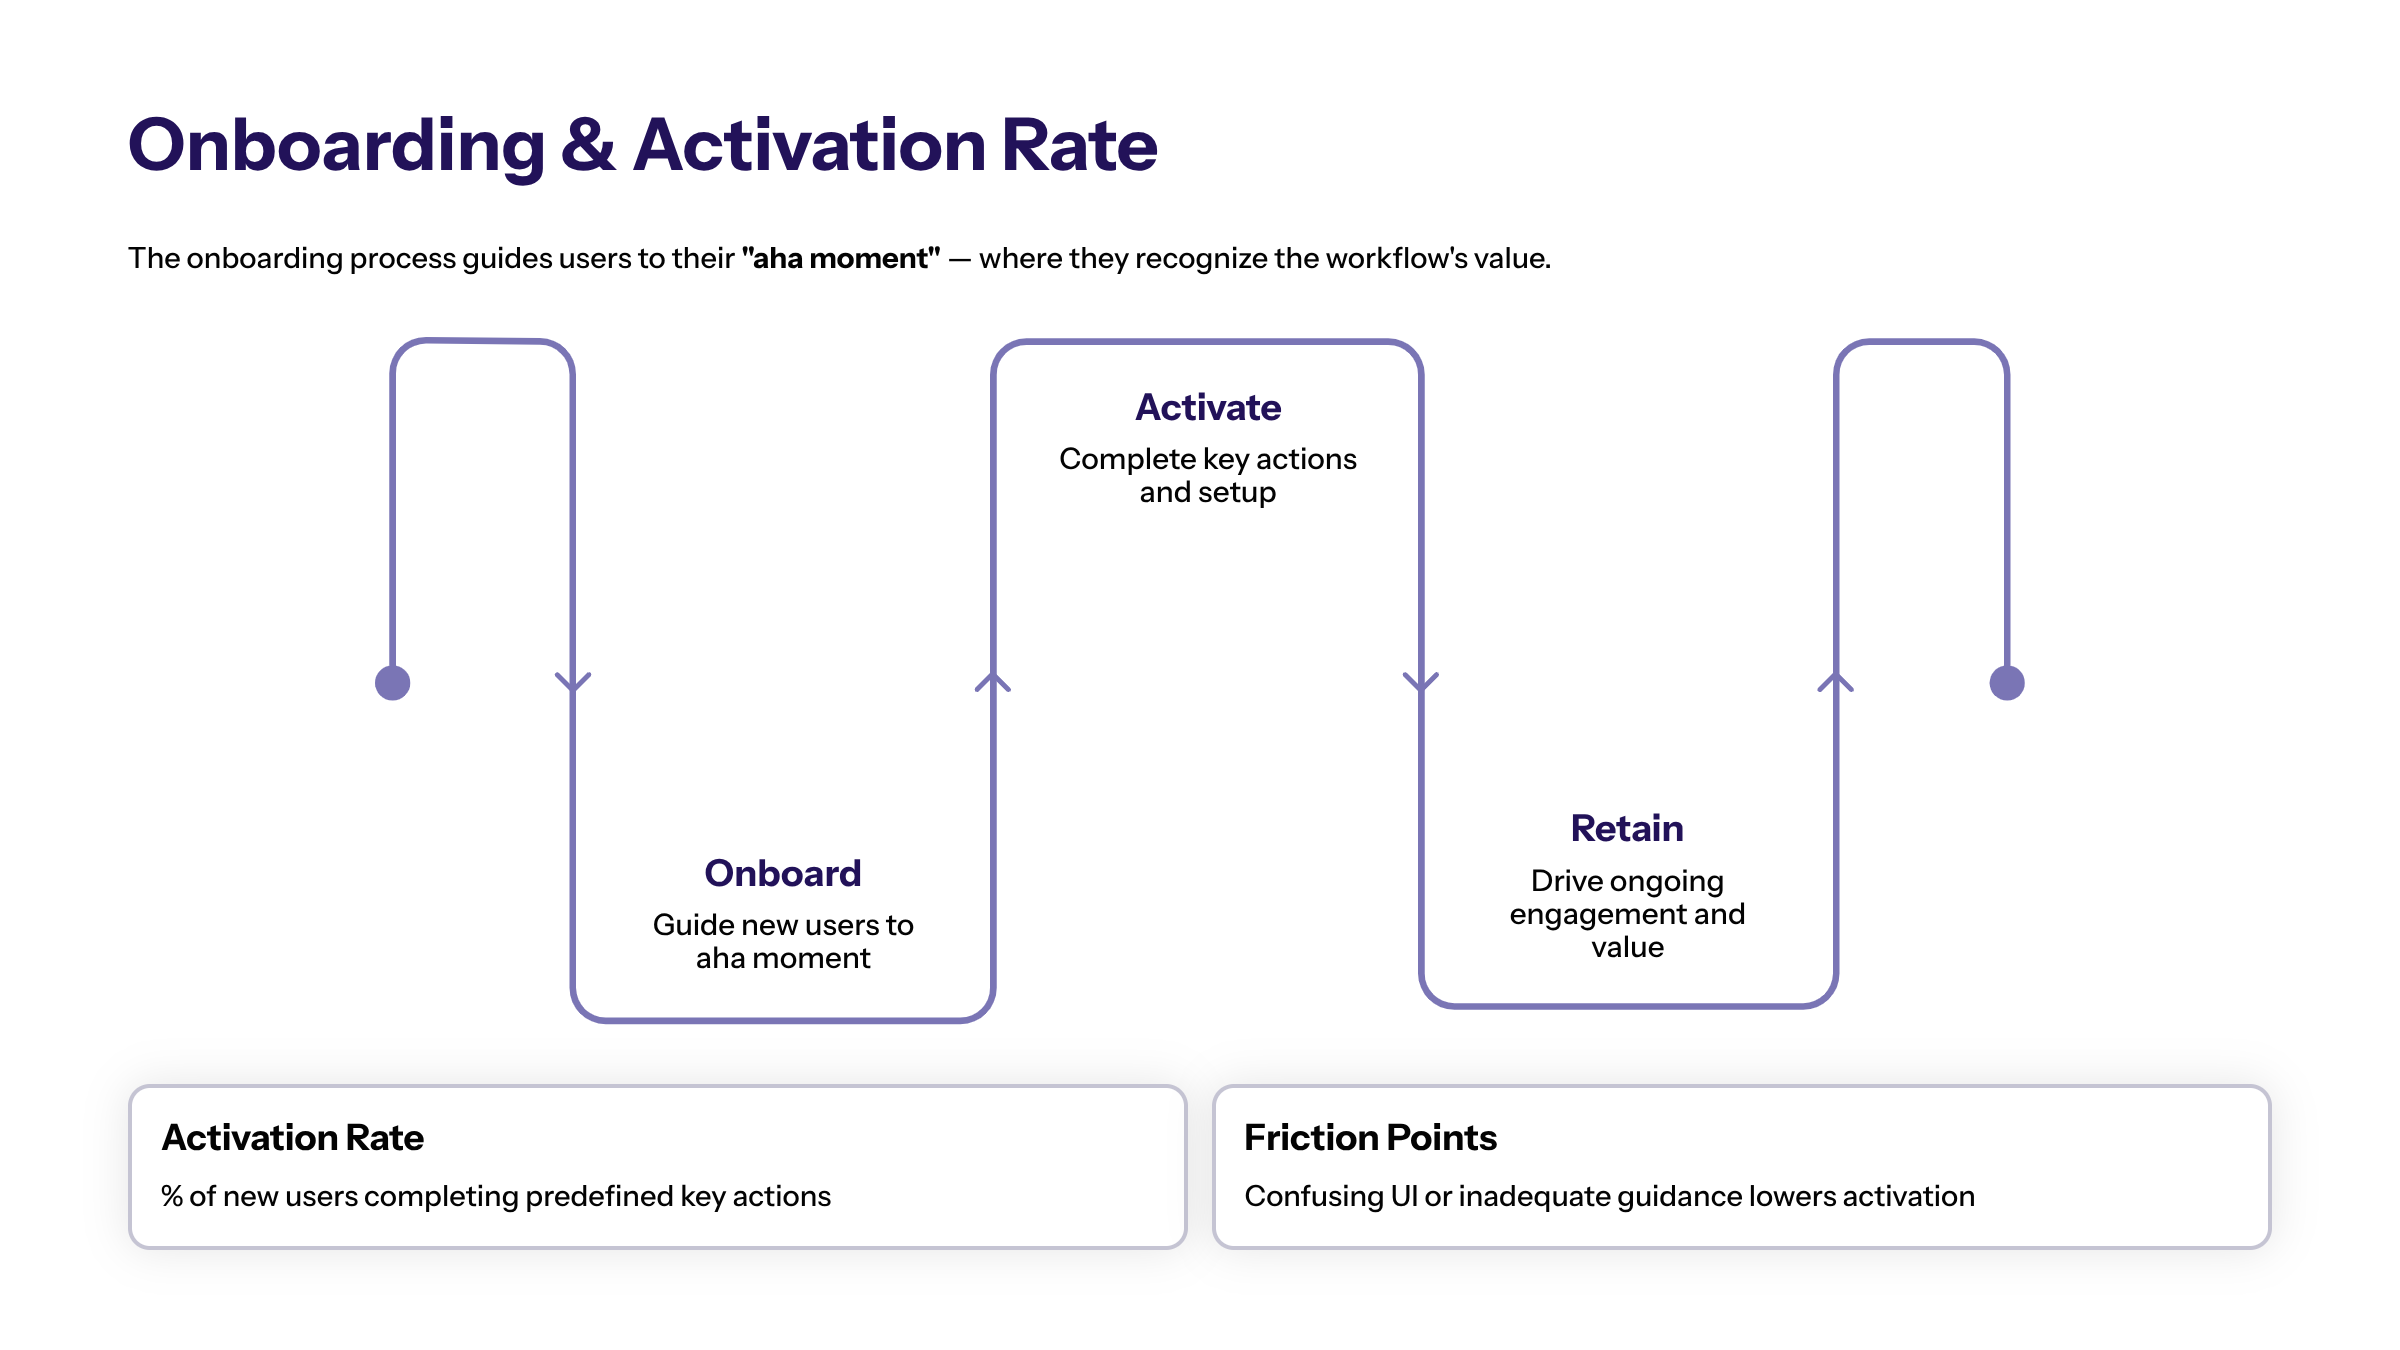
Onboarding Process and Activation Rate
The onboarding process is pivotal in guiding users to the workflow’s “aha moment”—the point where users recognize its value. Activation rate quantifies the proportion of new users who complete predefined key actions, signaling successful onboarding.
Low activation rates often highlight friction points such as confusing user interfaces or inadequate guidance. Incorporating in-app prompts, tooltips, and personalized walkthroughs can significantly improve activation rates and user satisfaction.
Guide Users Through Onboarding
Effective onboarding strategies include:
Segmenting users based on user preferences and roles to deliver tailored content.
Using analytics tools to monitor where users drop off during onboarding.
Conducting user interviews to gather qualitative feedback that informs onboarding improvements.
Salesforce’s adoption of personalized onboarding flows increased activation rates by 25%, demonstrating the impact of user-centric design.
Digital Adoption Platforms (DAPs) play a crucial role in this process by providing analytic capabilities to track user behavior and software usage effectively. They enable organizations to create in-app guidance and support, analyze user engagement, and identify areas of friction in the user journey. Real-time user feedback collected through DAPs helps teams understand user struggles and needs, allowing for continuous onboarding optimization.
Key Metrics for Workflow Adoption
Beyond activation and feature adoption, several other metrics provide a comprehensive view of workflow adoption:
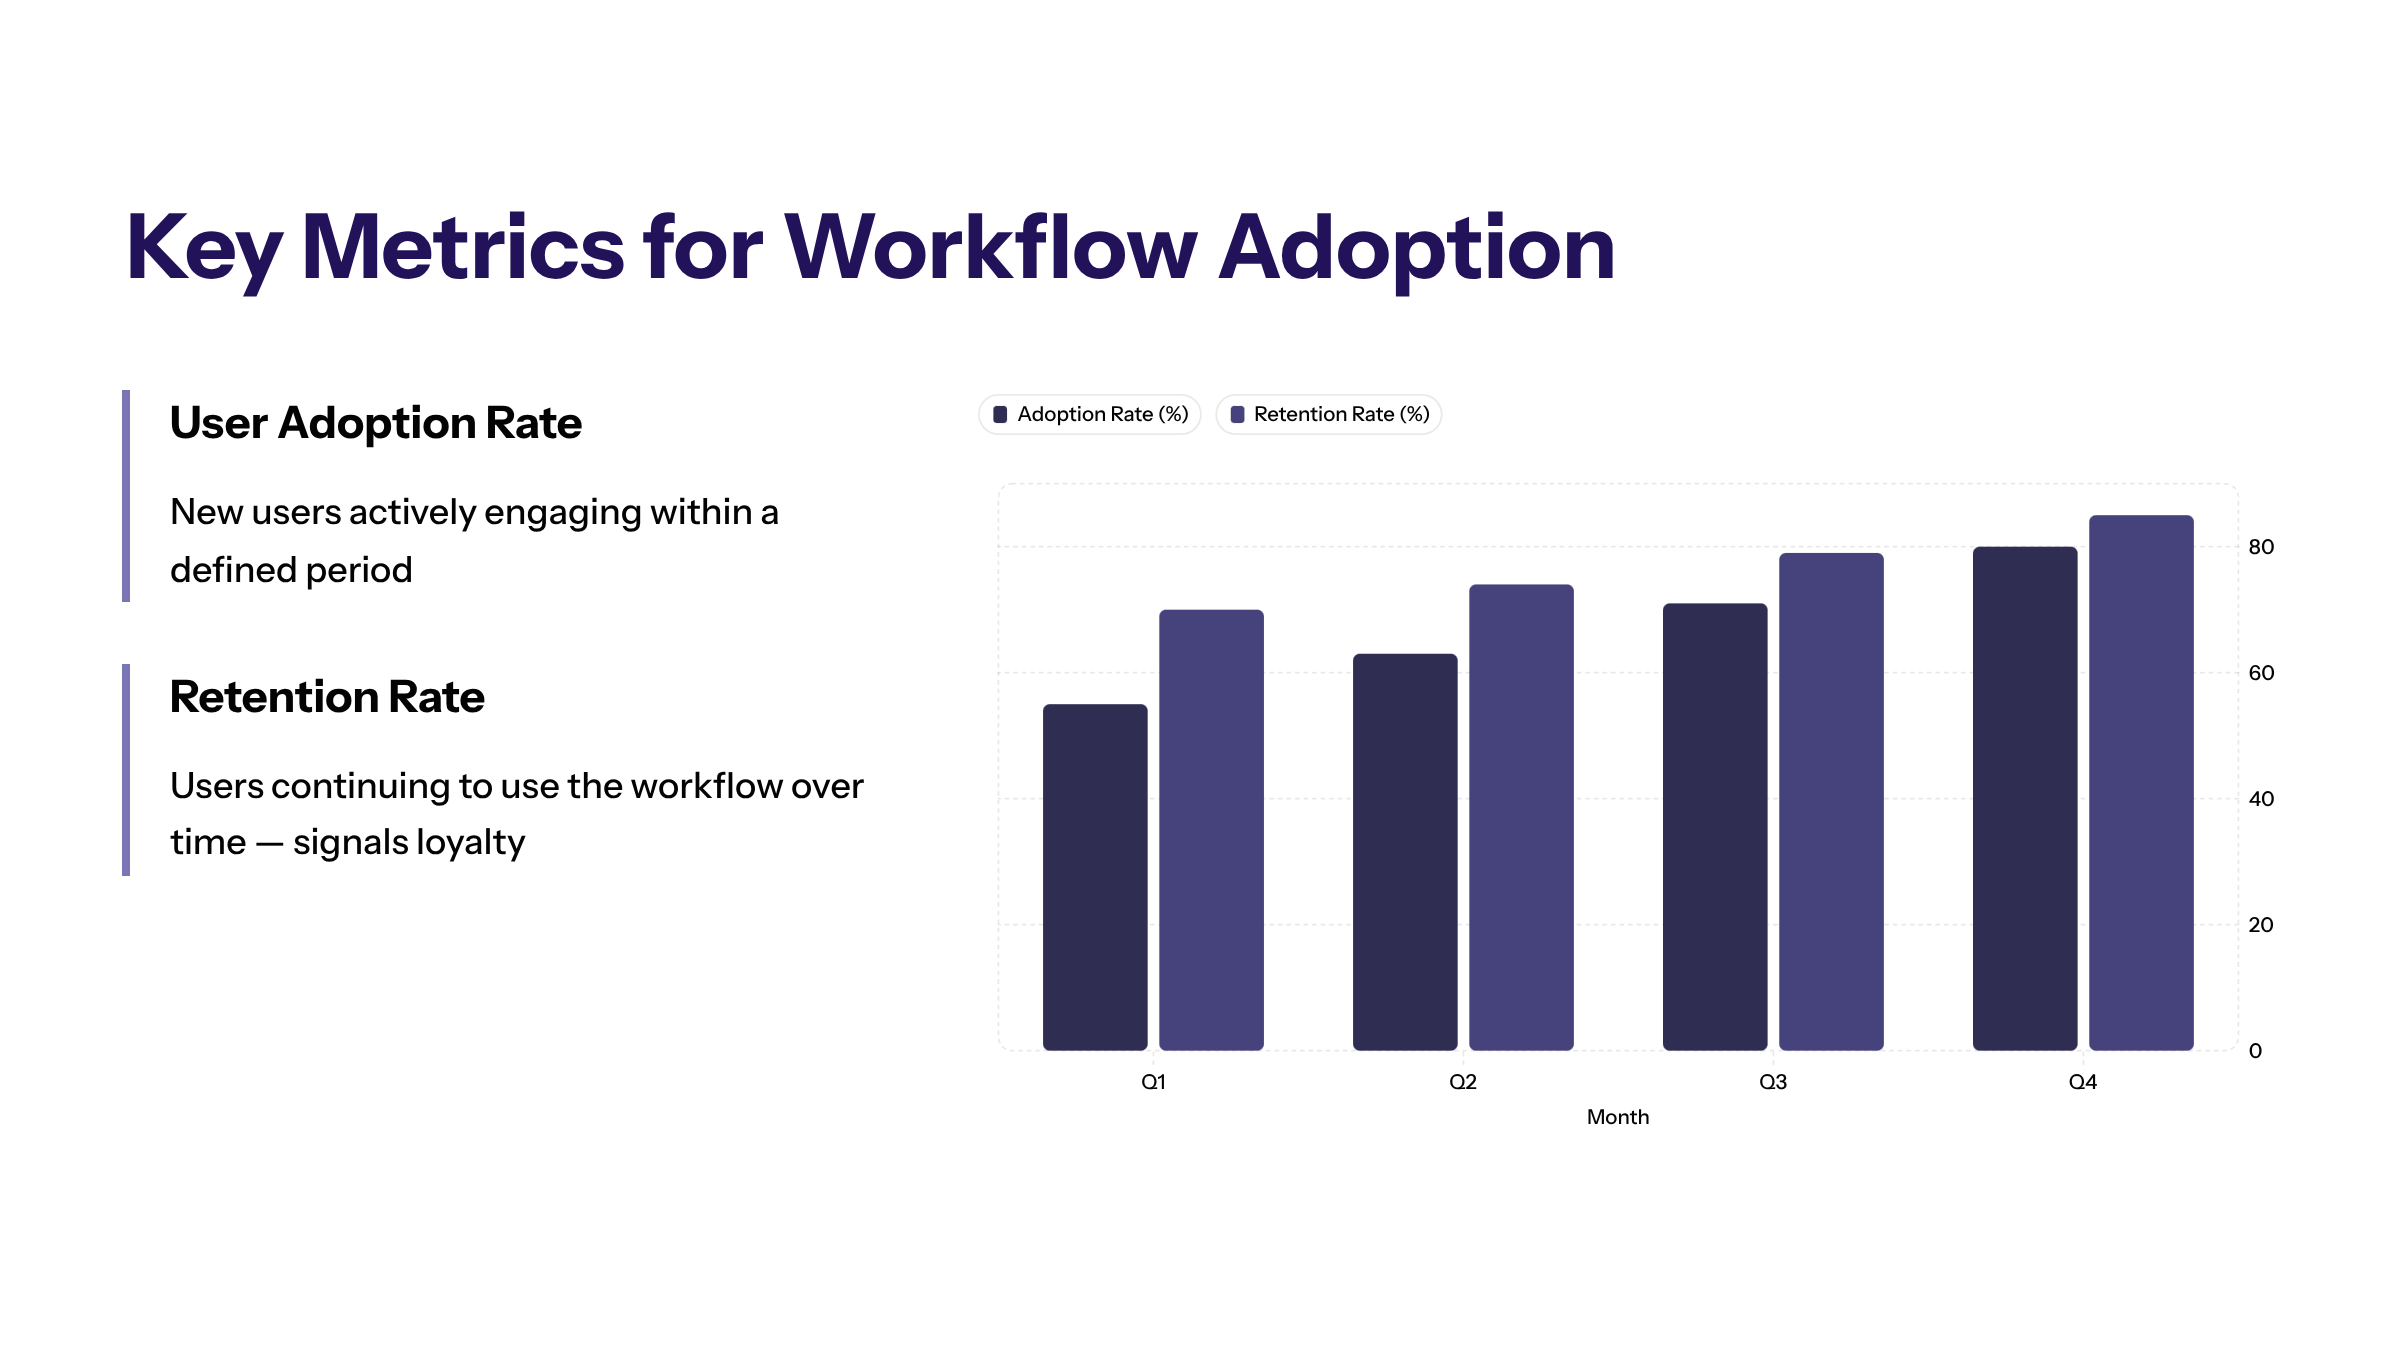
User Adoption Rate
Measures the percentage of new users who actively engage with the workflow within a defined period, reflecting the overall success of adoption efforts.
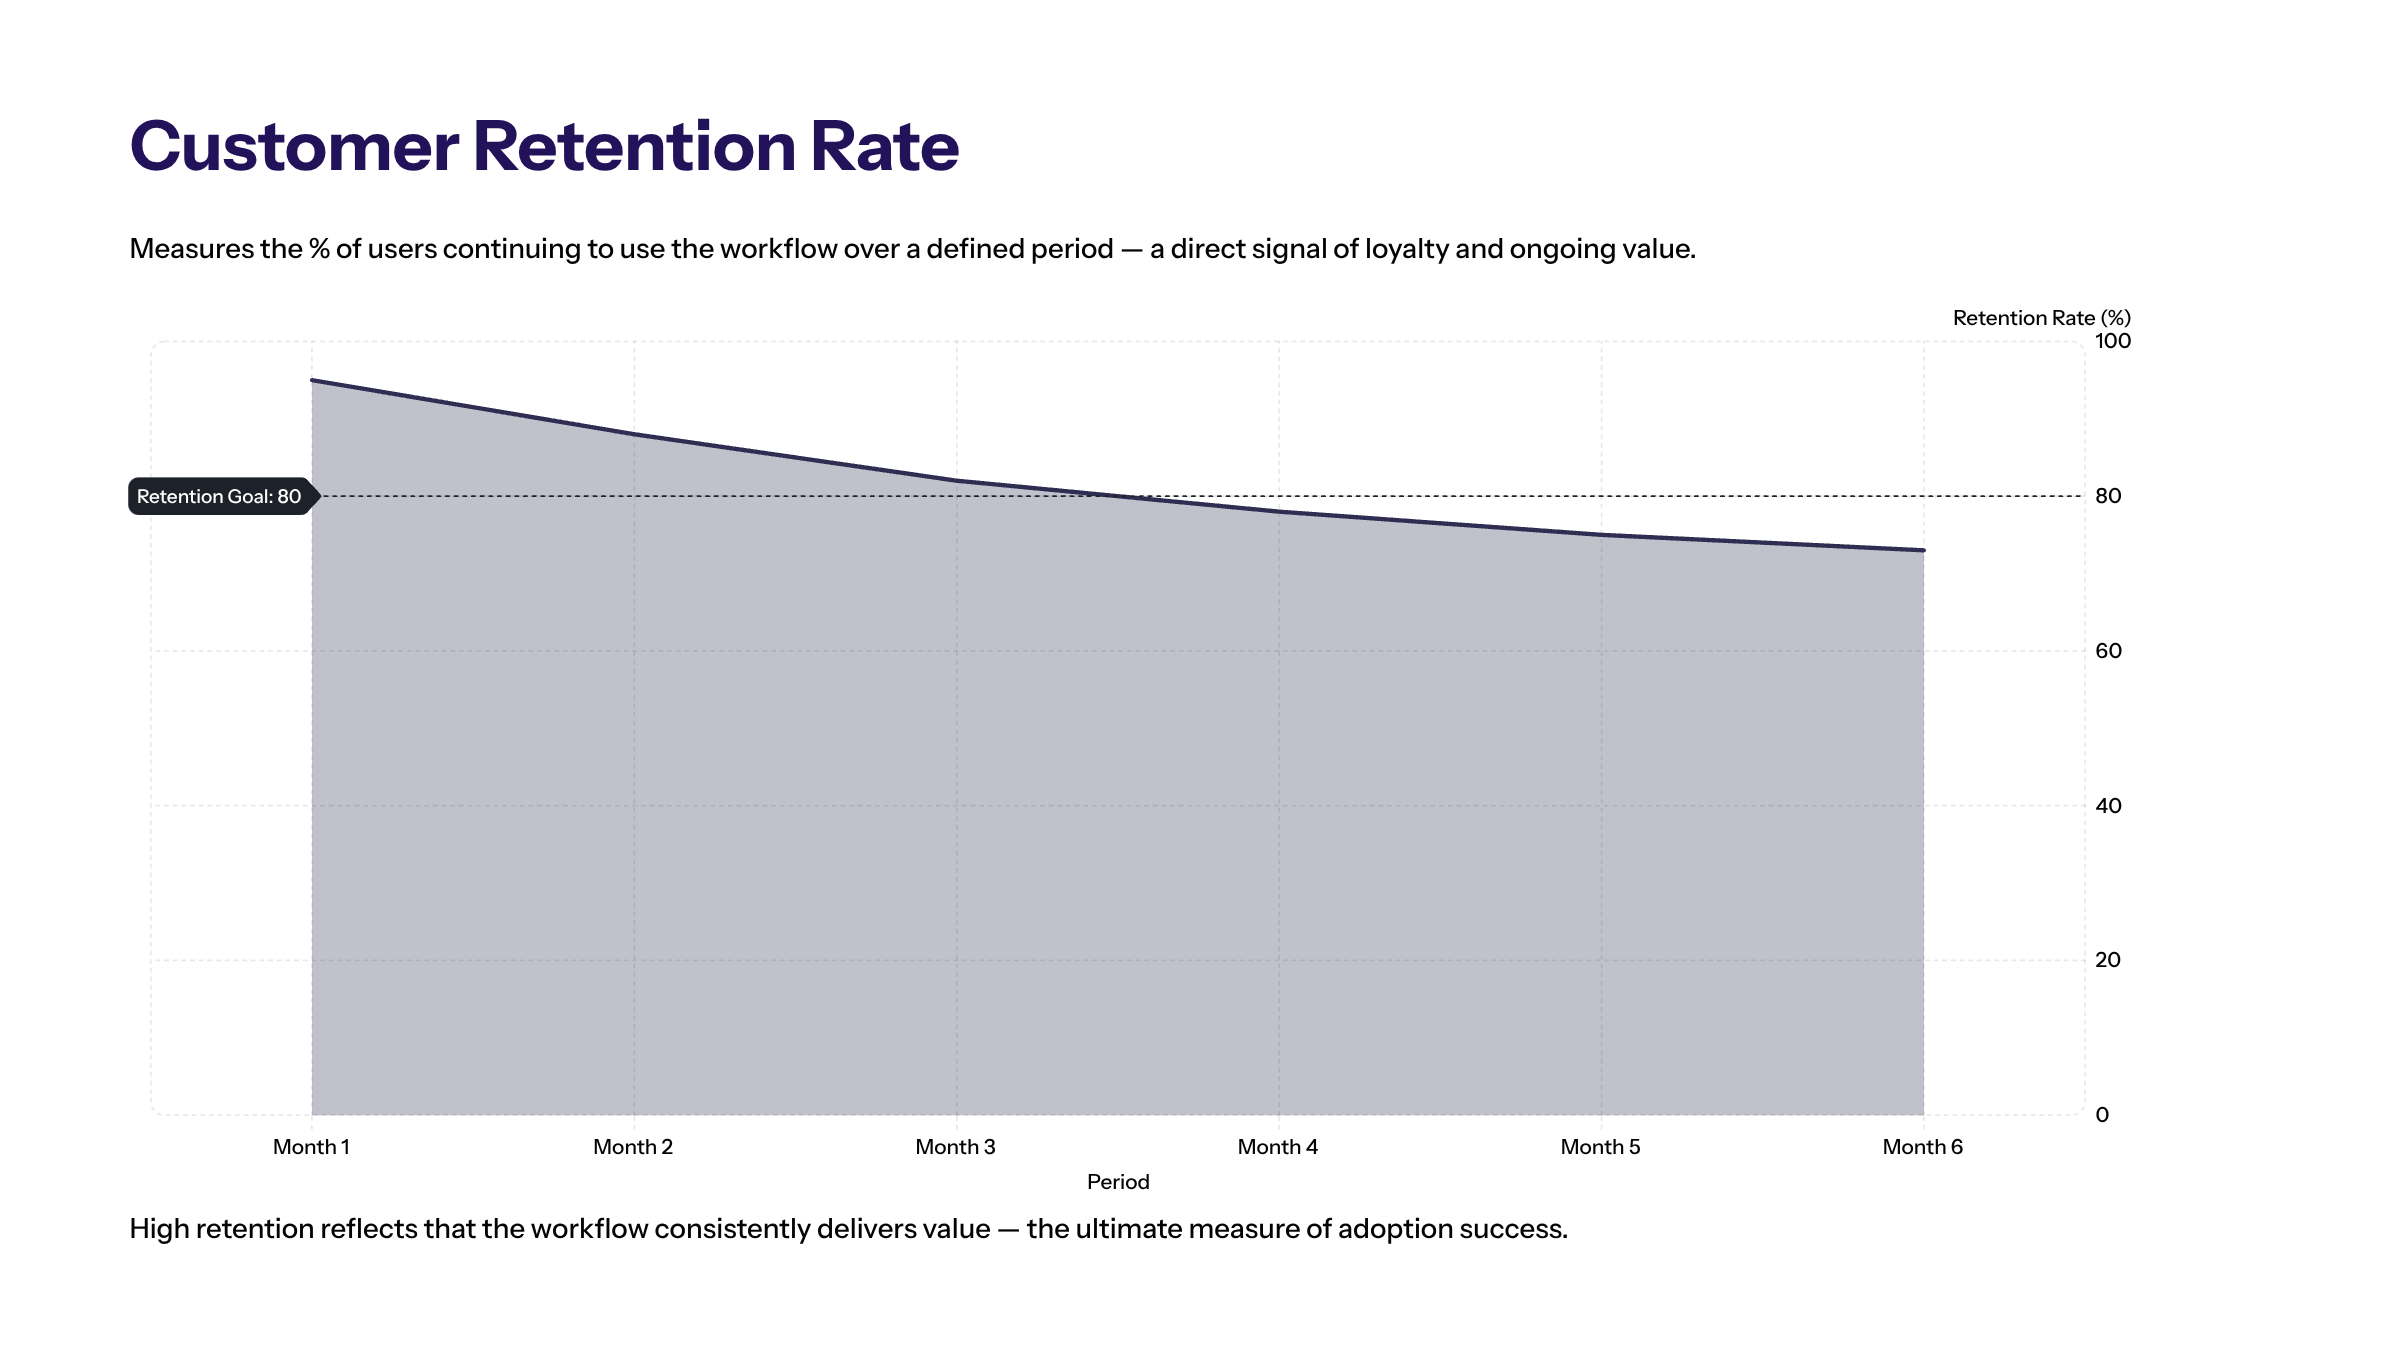
Retention Rate
Indicates the proportion of users who continue using the workflow over time, directly correlating with user loyalty and ongoing value realization. A high retention rate means that users find ongoing benefits in the product, which is essential for sustained business growth.
Churn Rate
Represents the percentage of users lost during a period, signaling issues in user satisfaction or workflow relevance. A high churn rate is typically a red flag, suggesting unresolved issues such as a poor onboarding process or limited perceived value.
Average Usage Frequency
Tracks how often users interact with the workflow, highlighting its integration into daily routines.
Customer Lifetime Value (CLTV)
Estimates the total value a user contributes over their engagement period, linking adoption metrics to revenue outcomes.
Metric | Formula | Insight Provided |
|---|---|---|
User Adoption Rate | (Active new users / Total new users) x 100 | Measures initial adoption success |
Retention Rate | ((Users at period end – New users during period) / Users at period start) x 100 | Shows sustained usage and loyalty |
Churn Rate | (Users lost during period / Users at period start) x 100 | Highlights user loss and potential dissatisfaction |
Average Usage Frequency | Total sessions / Number of users | Indicates how integral the workflow is to users |
Gartner emphasizes that product managers must monitor these metrics continuously to align product strategy with evolving user behavior and business goals.
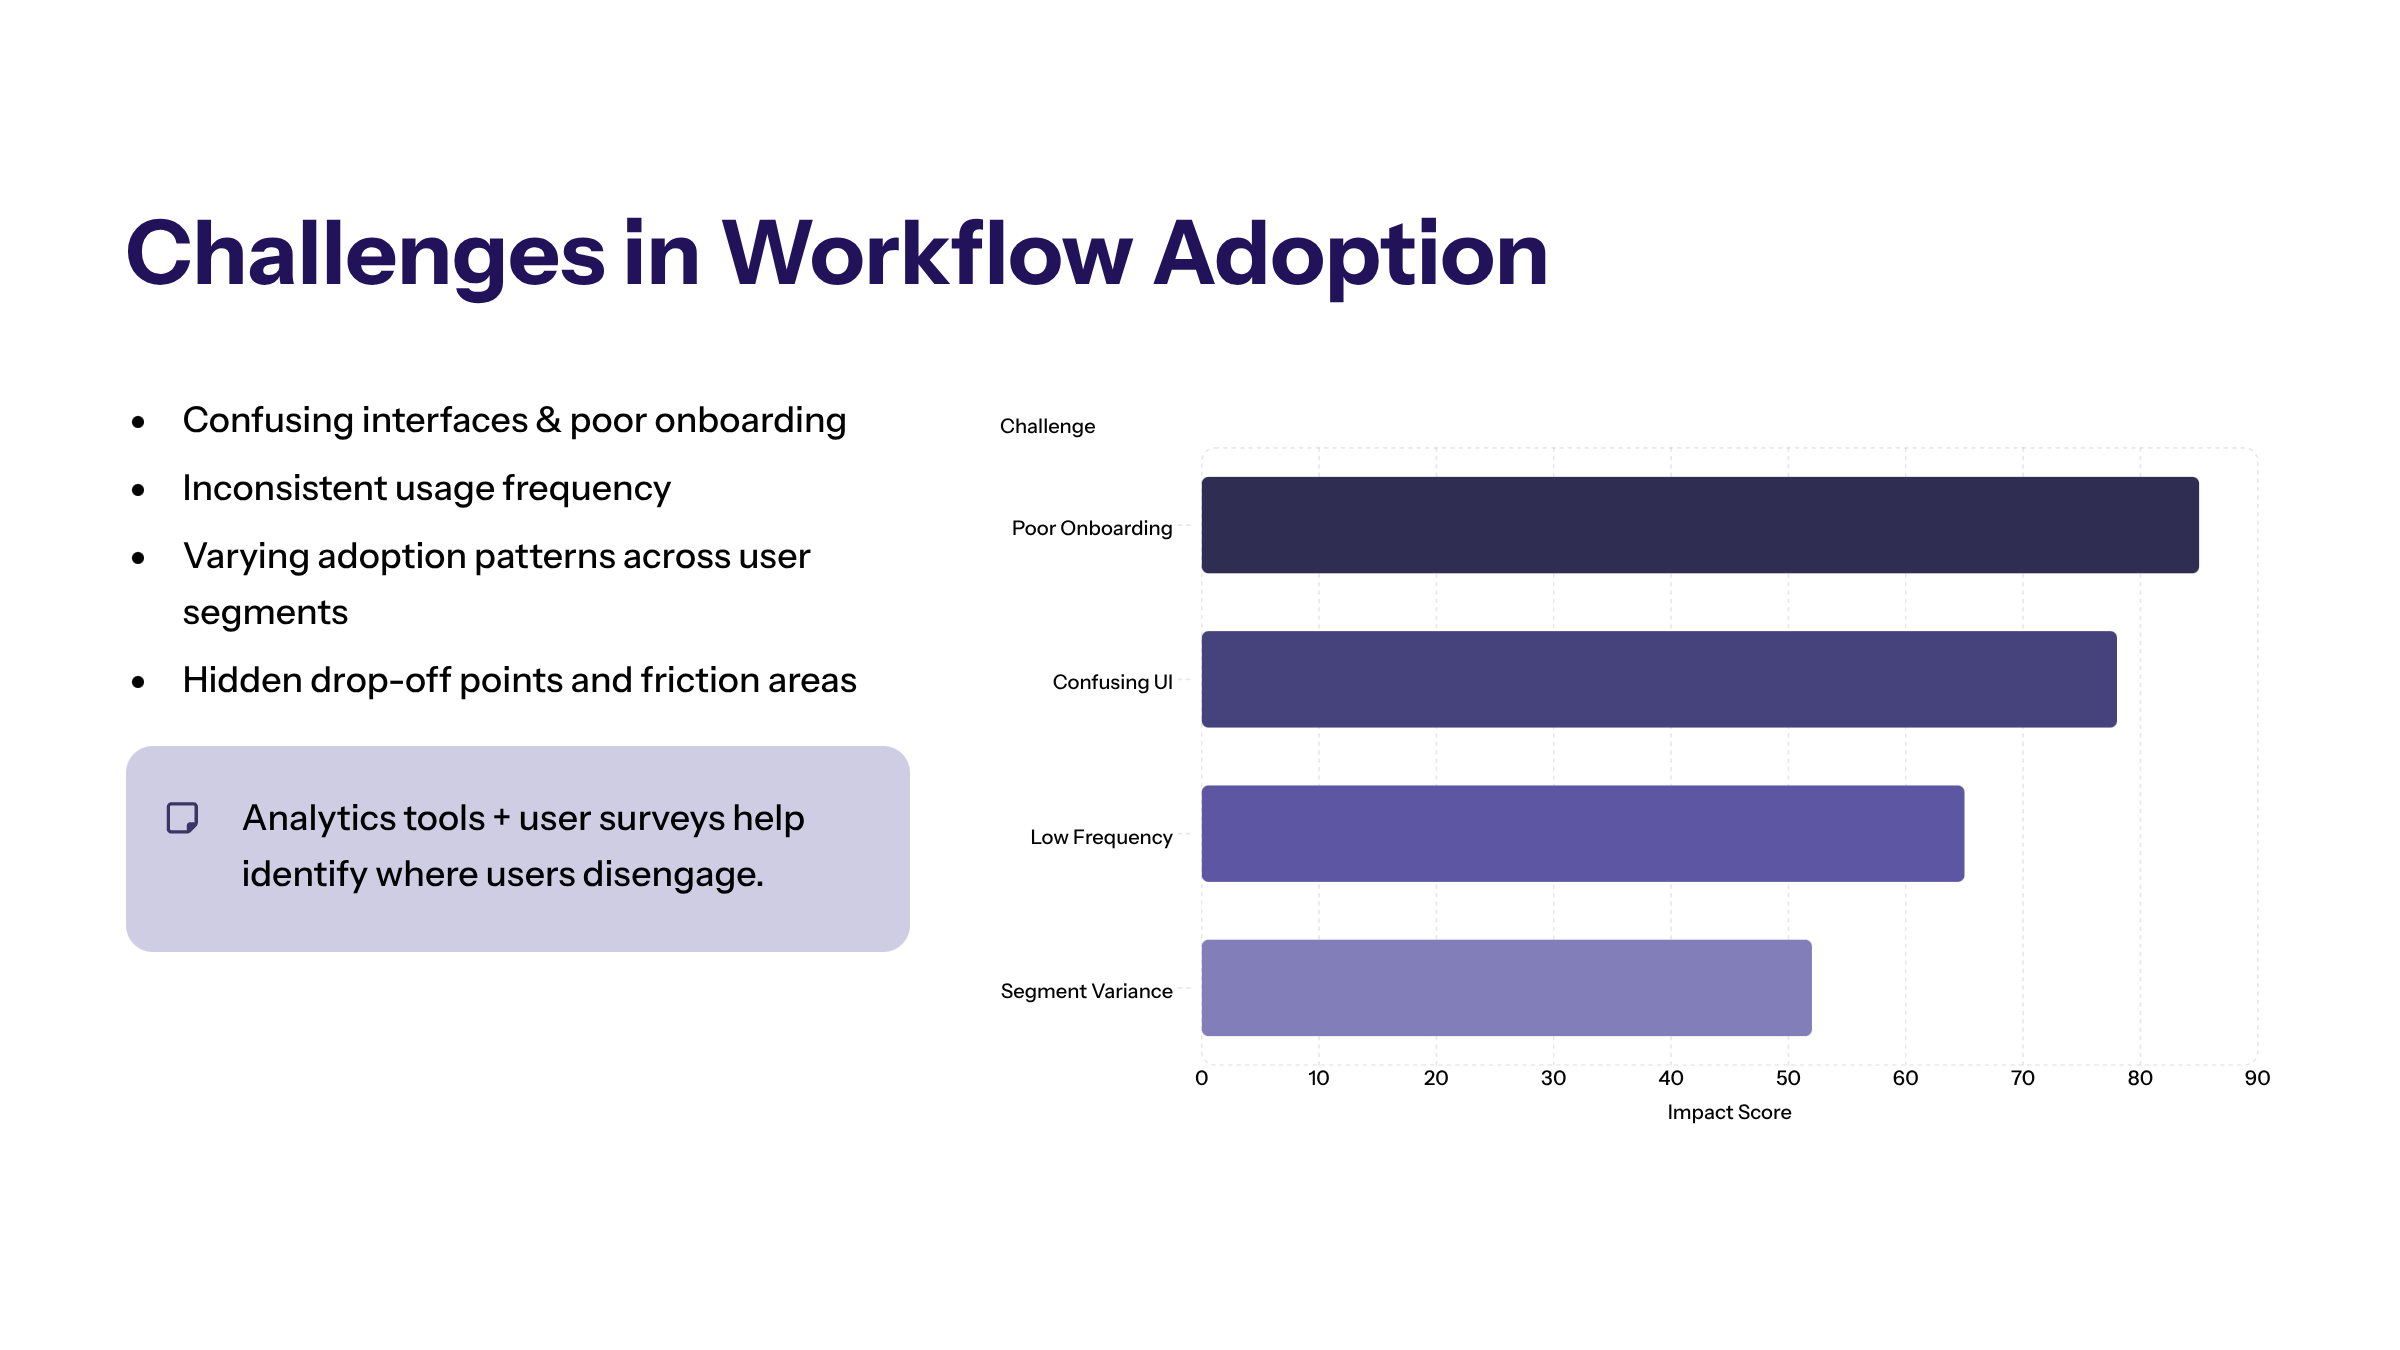
Challenges in Workflow Adoption
Common challenges include confusing user interfaces, poor onboarding, and inconsistent usage frequency. Different user segments often exhibit varying adoption patterns based on their unique needs and preferences, requiring targeted interventions.
Analytics tools, combined with user feedback mechanisms such as surveys and user interviews, help identify drop-off points and friction areas. Addressing these challenges is crucial to boosting user retention and reducing churn.
Error rate reduction benchmarks show that modern automated processes typically achieve a 40–75% decrease in errors compared to legacy systems, contributing to improved workflow reliability and user confidence.
A report by Forrester highlights that workflows failing to address diverse user groups experience up to 30% higher churn rates.
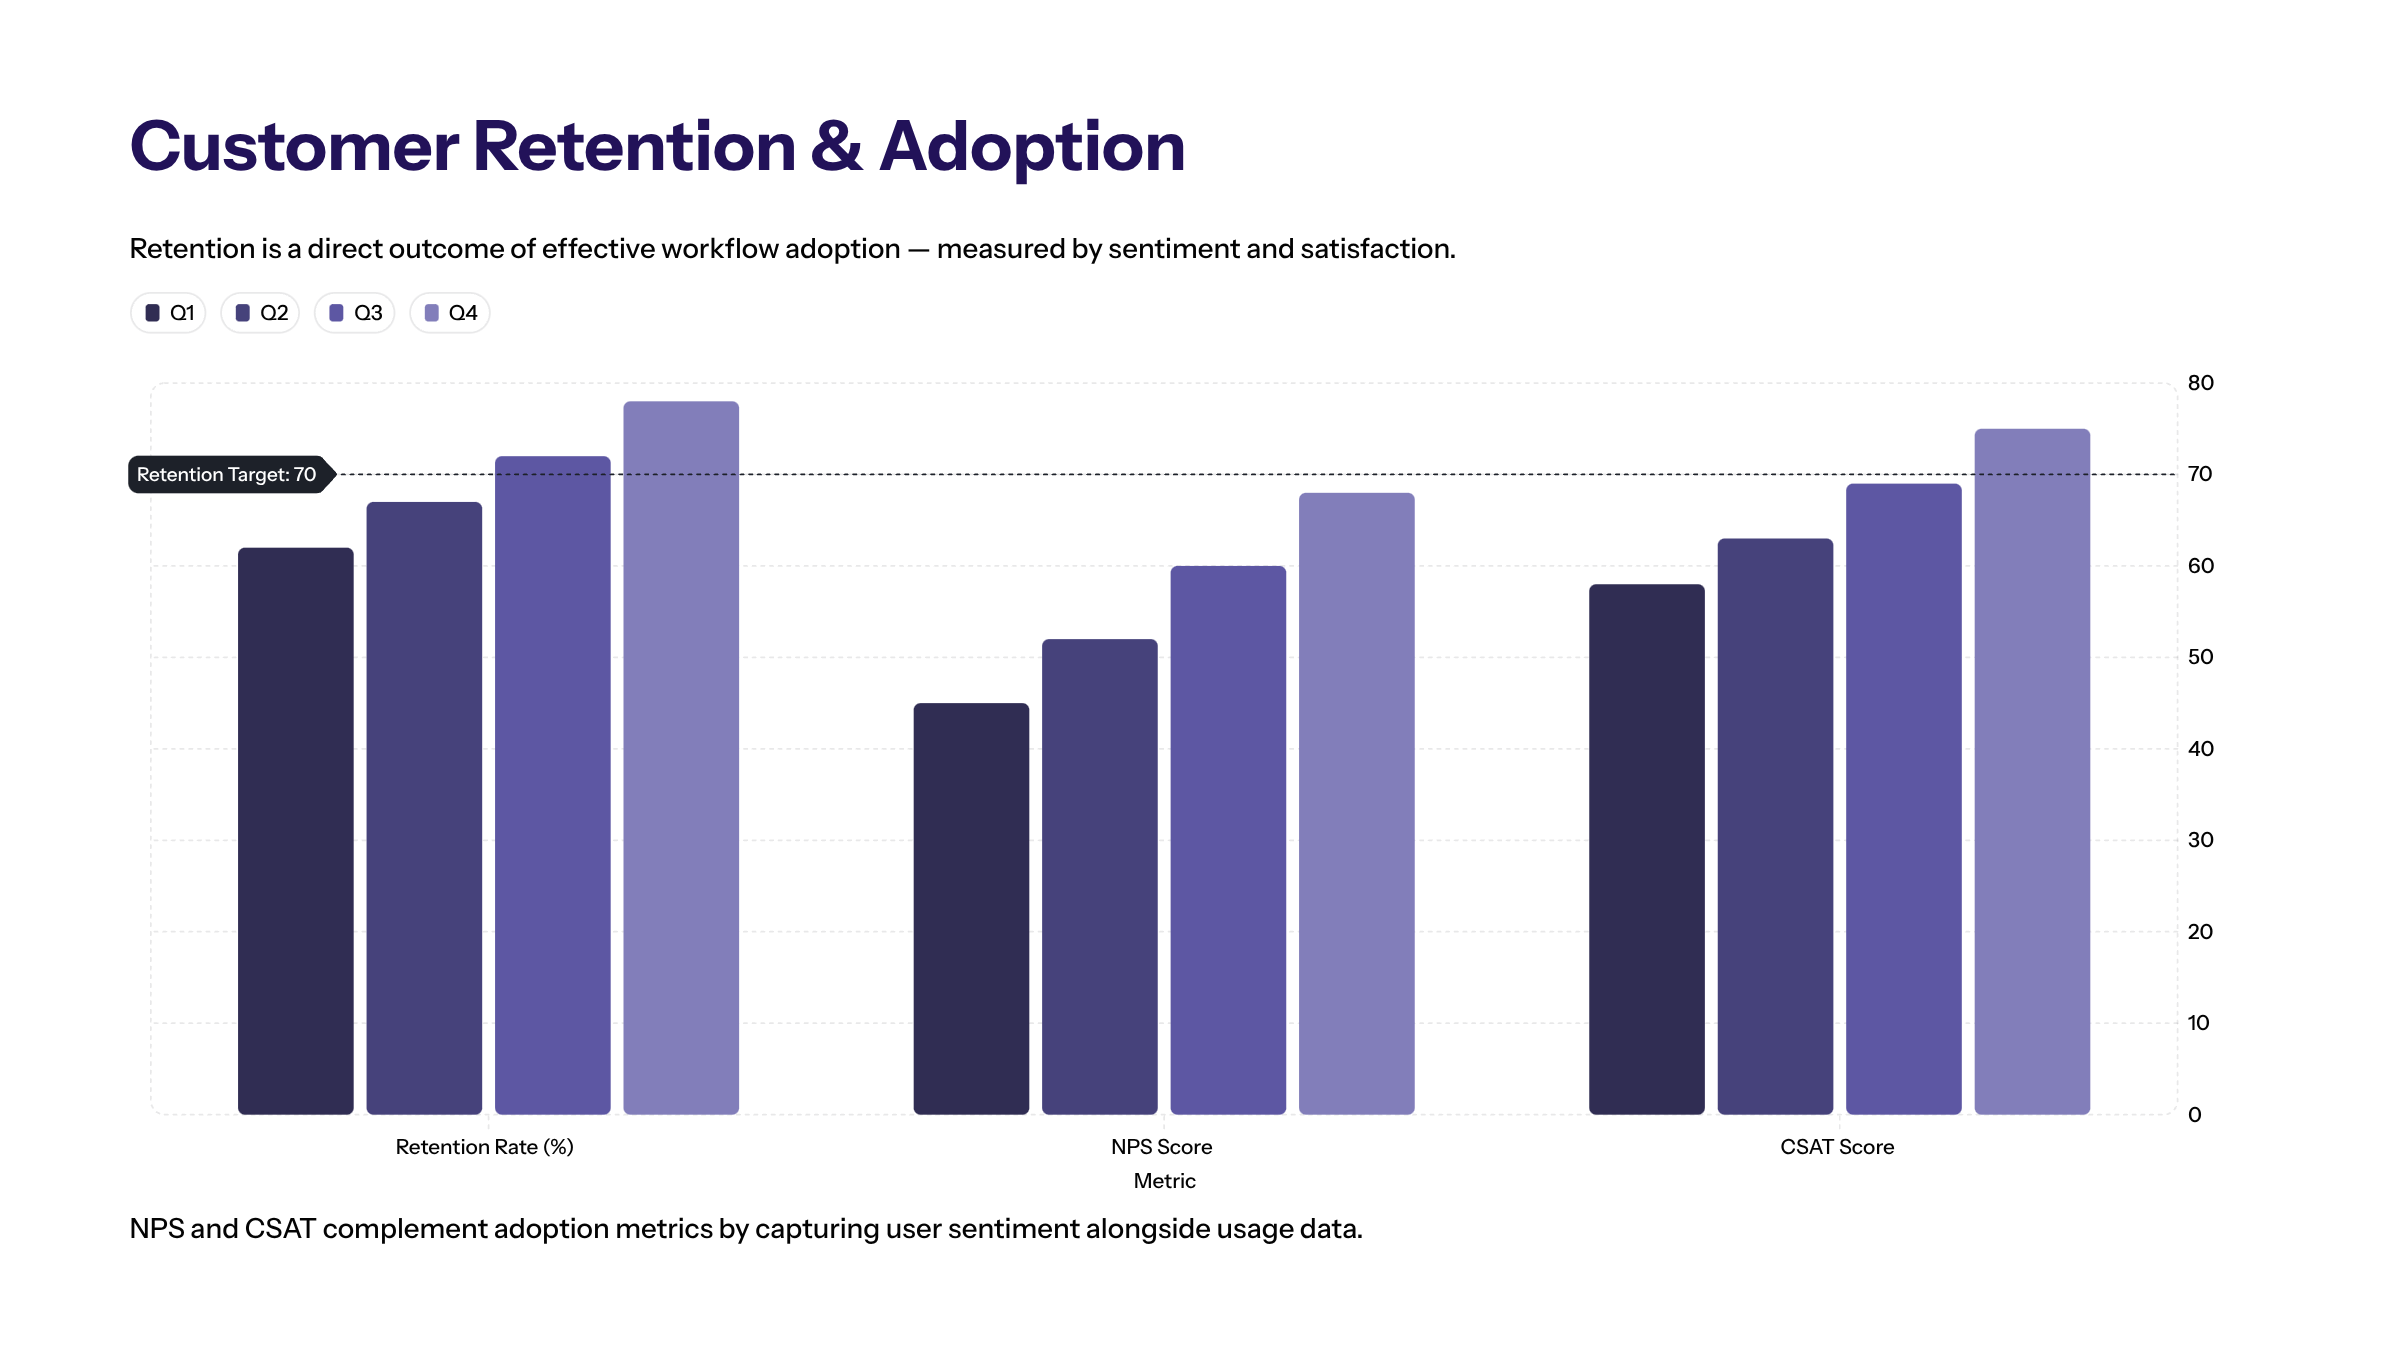
Customer Retention and Adoption Process
Customer retention is a direct outcome of effective workflow adoption. Designing adoption processes that meet user expectations and provide ongoing value is essential for maintaining user loyalty.
Metrics such as net promoter score (NPS) and customer satisfaction score (CSAT) complement adoption metrics by capturing user sentiment and satisfaction levels.
NPS measures how likely users are to recommend your product to others, typically on a scale of 0 to 10. A high NPS indicates that users are not only satisfied but also enthusiastic enough to promote the product, driving organic growth.
CSAT measures user satisfaction with a specific interaction, feature, or overall experience. A high CSAT score reflects strong user satisfaction, while a low score signals a need for improvement in user experience or product functionality.
User Surveys and Interviews
Collecting qualitative data through user surveys and interviews enriches quantitative insights, enabling organizations to tailor workflows to user needs and preferences.
Employee feedback includes satisfaction levels, ease of use, and perceived clarity in processes, all of which are critical for evaluating adoption success.
According to McKinsey, combining user insights with analytics leads to a 20% improvement in adoption rates.
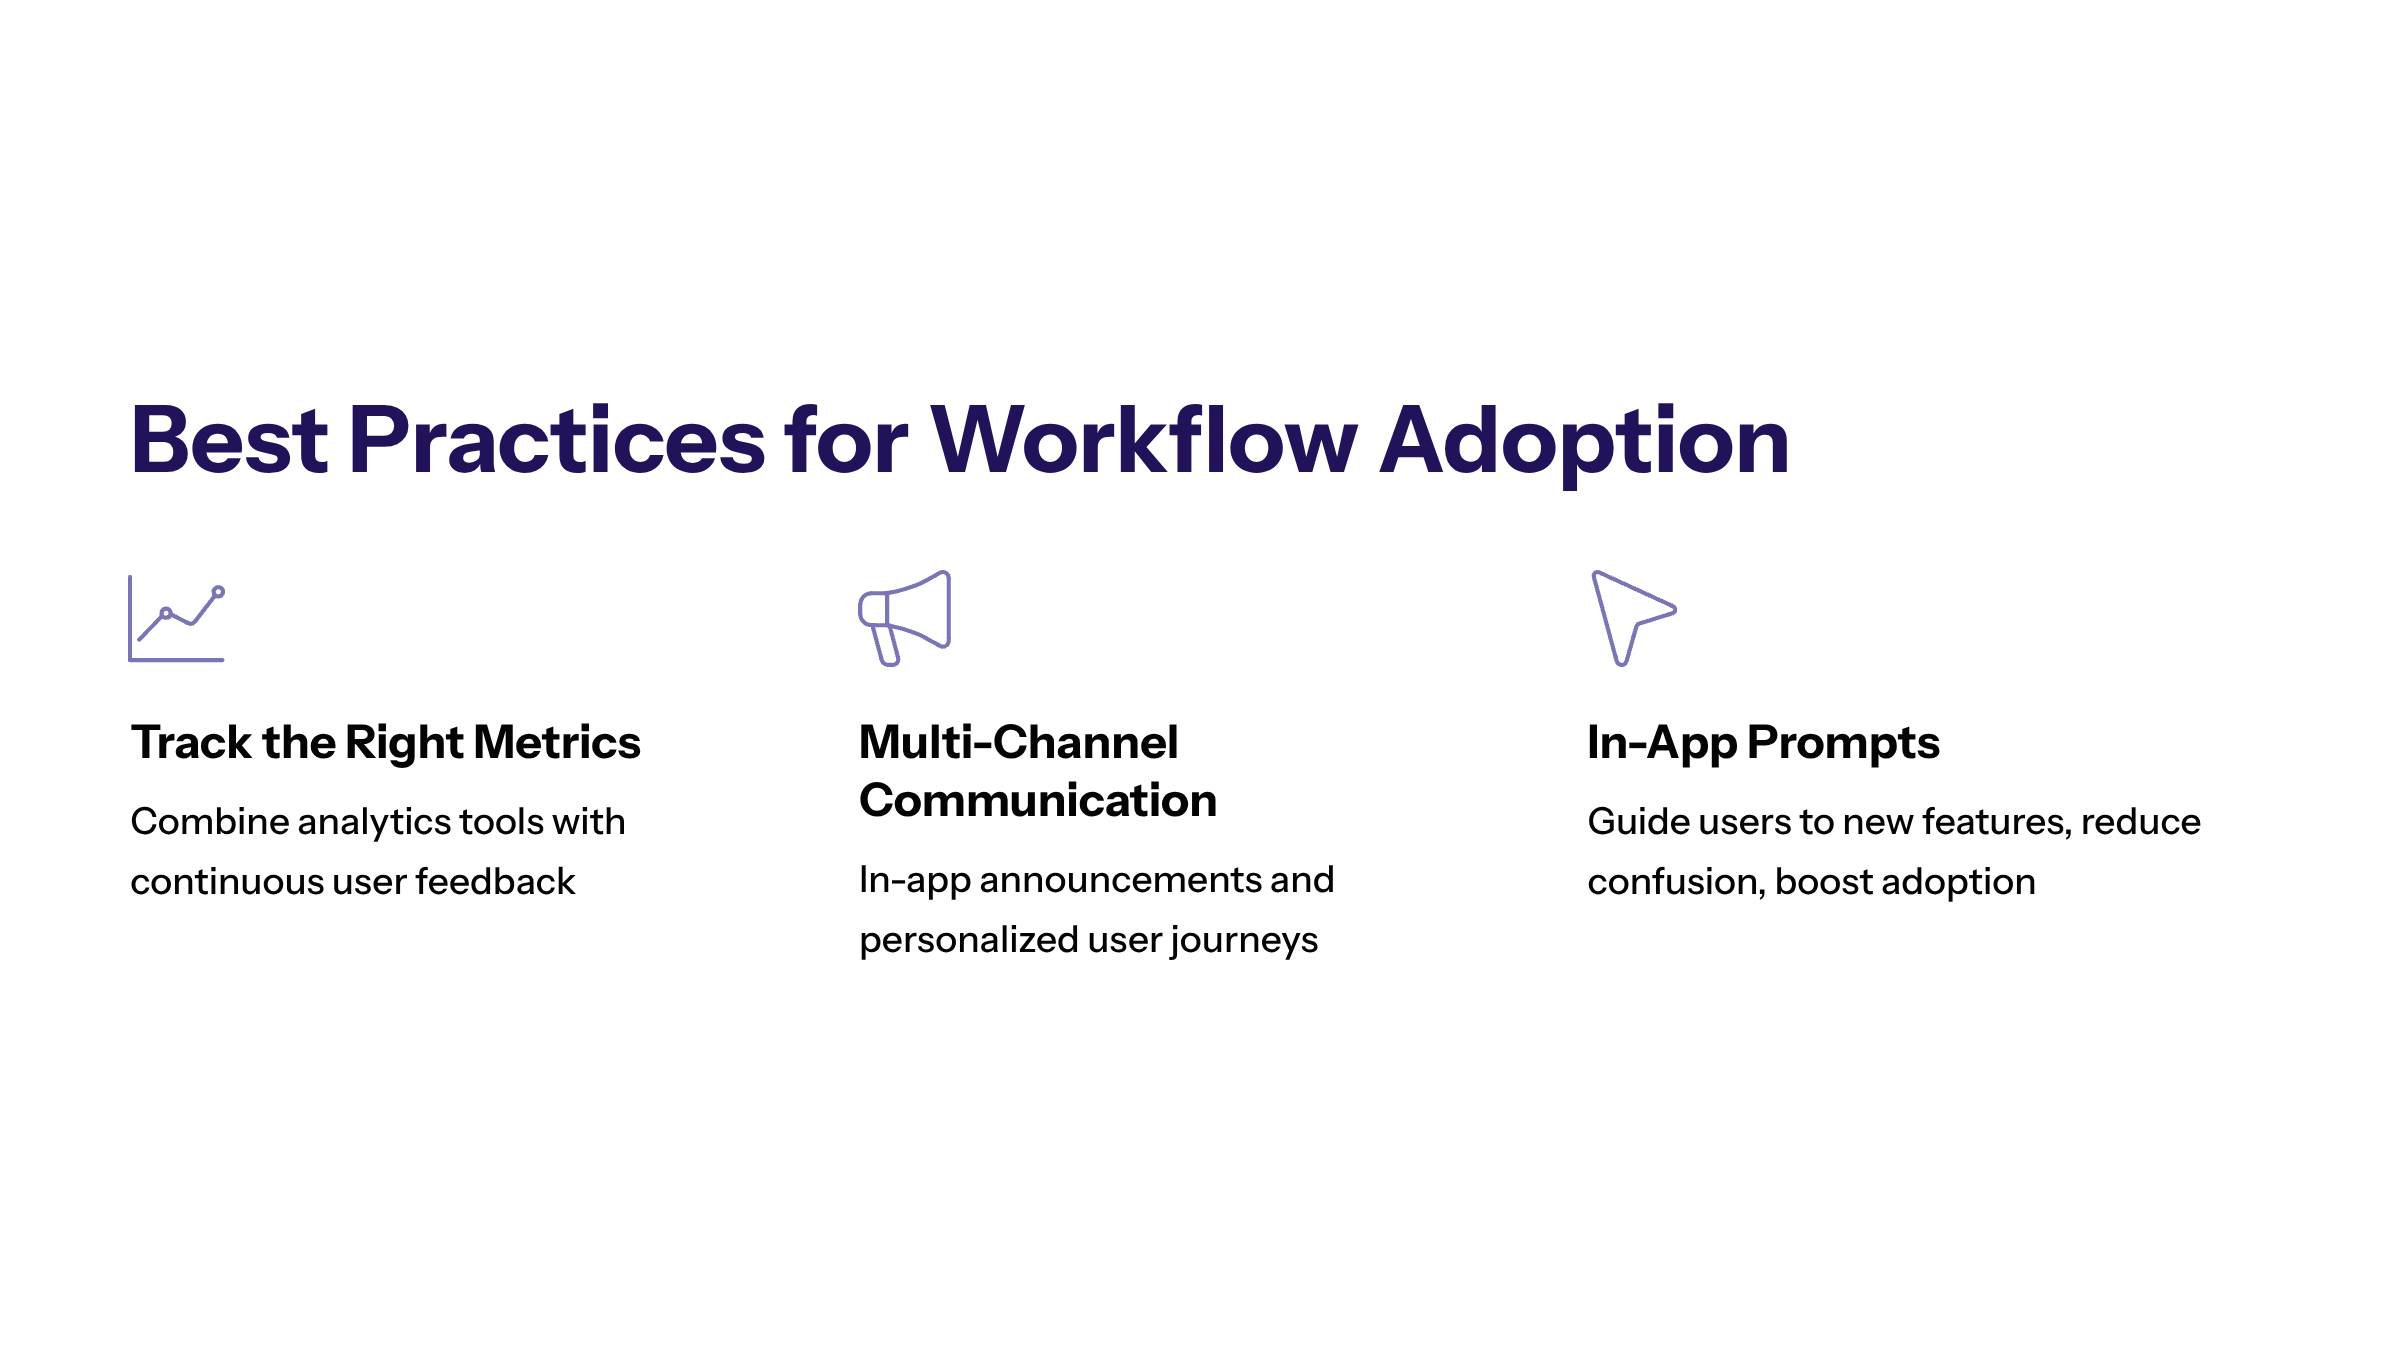
Best Practices for Workflow Adoption
Successful workflow adoption relies on a combination of tracking the right product adoption metrics, leveraging analytics tools, and gathering continuous user feedback.
Targeted Improvements
Implementing in-app feature announcements, multi-channel communication, and personalized user journeys can significantly boost customer satisfaction and retention.
Adding in-app prompts helps guide users to new features and reduces confusion, increasing feature adoption and overall workflow efficiency.
Ongoing Monitoring
Regular evaluation of workflow adoption metrics allows for timely identification of issues and the agility to optimize workflows continuously.
Time to proficiency indicates how long it takes for employees to reach full competence in a new workflow post-training, providing a benchmark for training effectiveness.
Process adherence measures how consistently users follow defined workflow steps, ensuring that workflows are executed as intended.
Microsoft’s use of AI-driven analytics to personalize user experiences has resulted in a 30% increase in workflow adoption across enterprise teams.
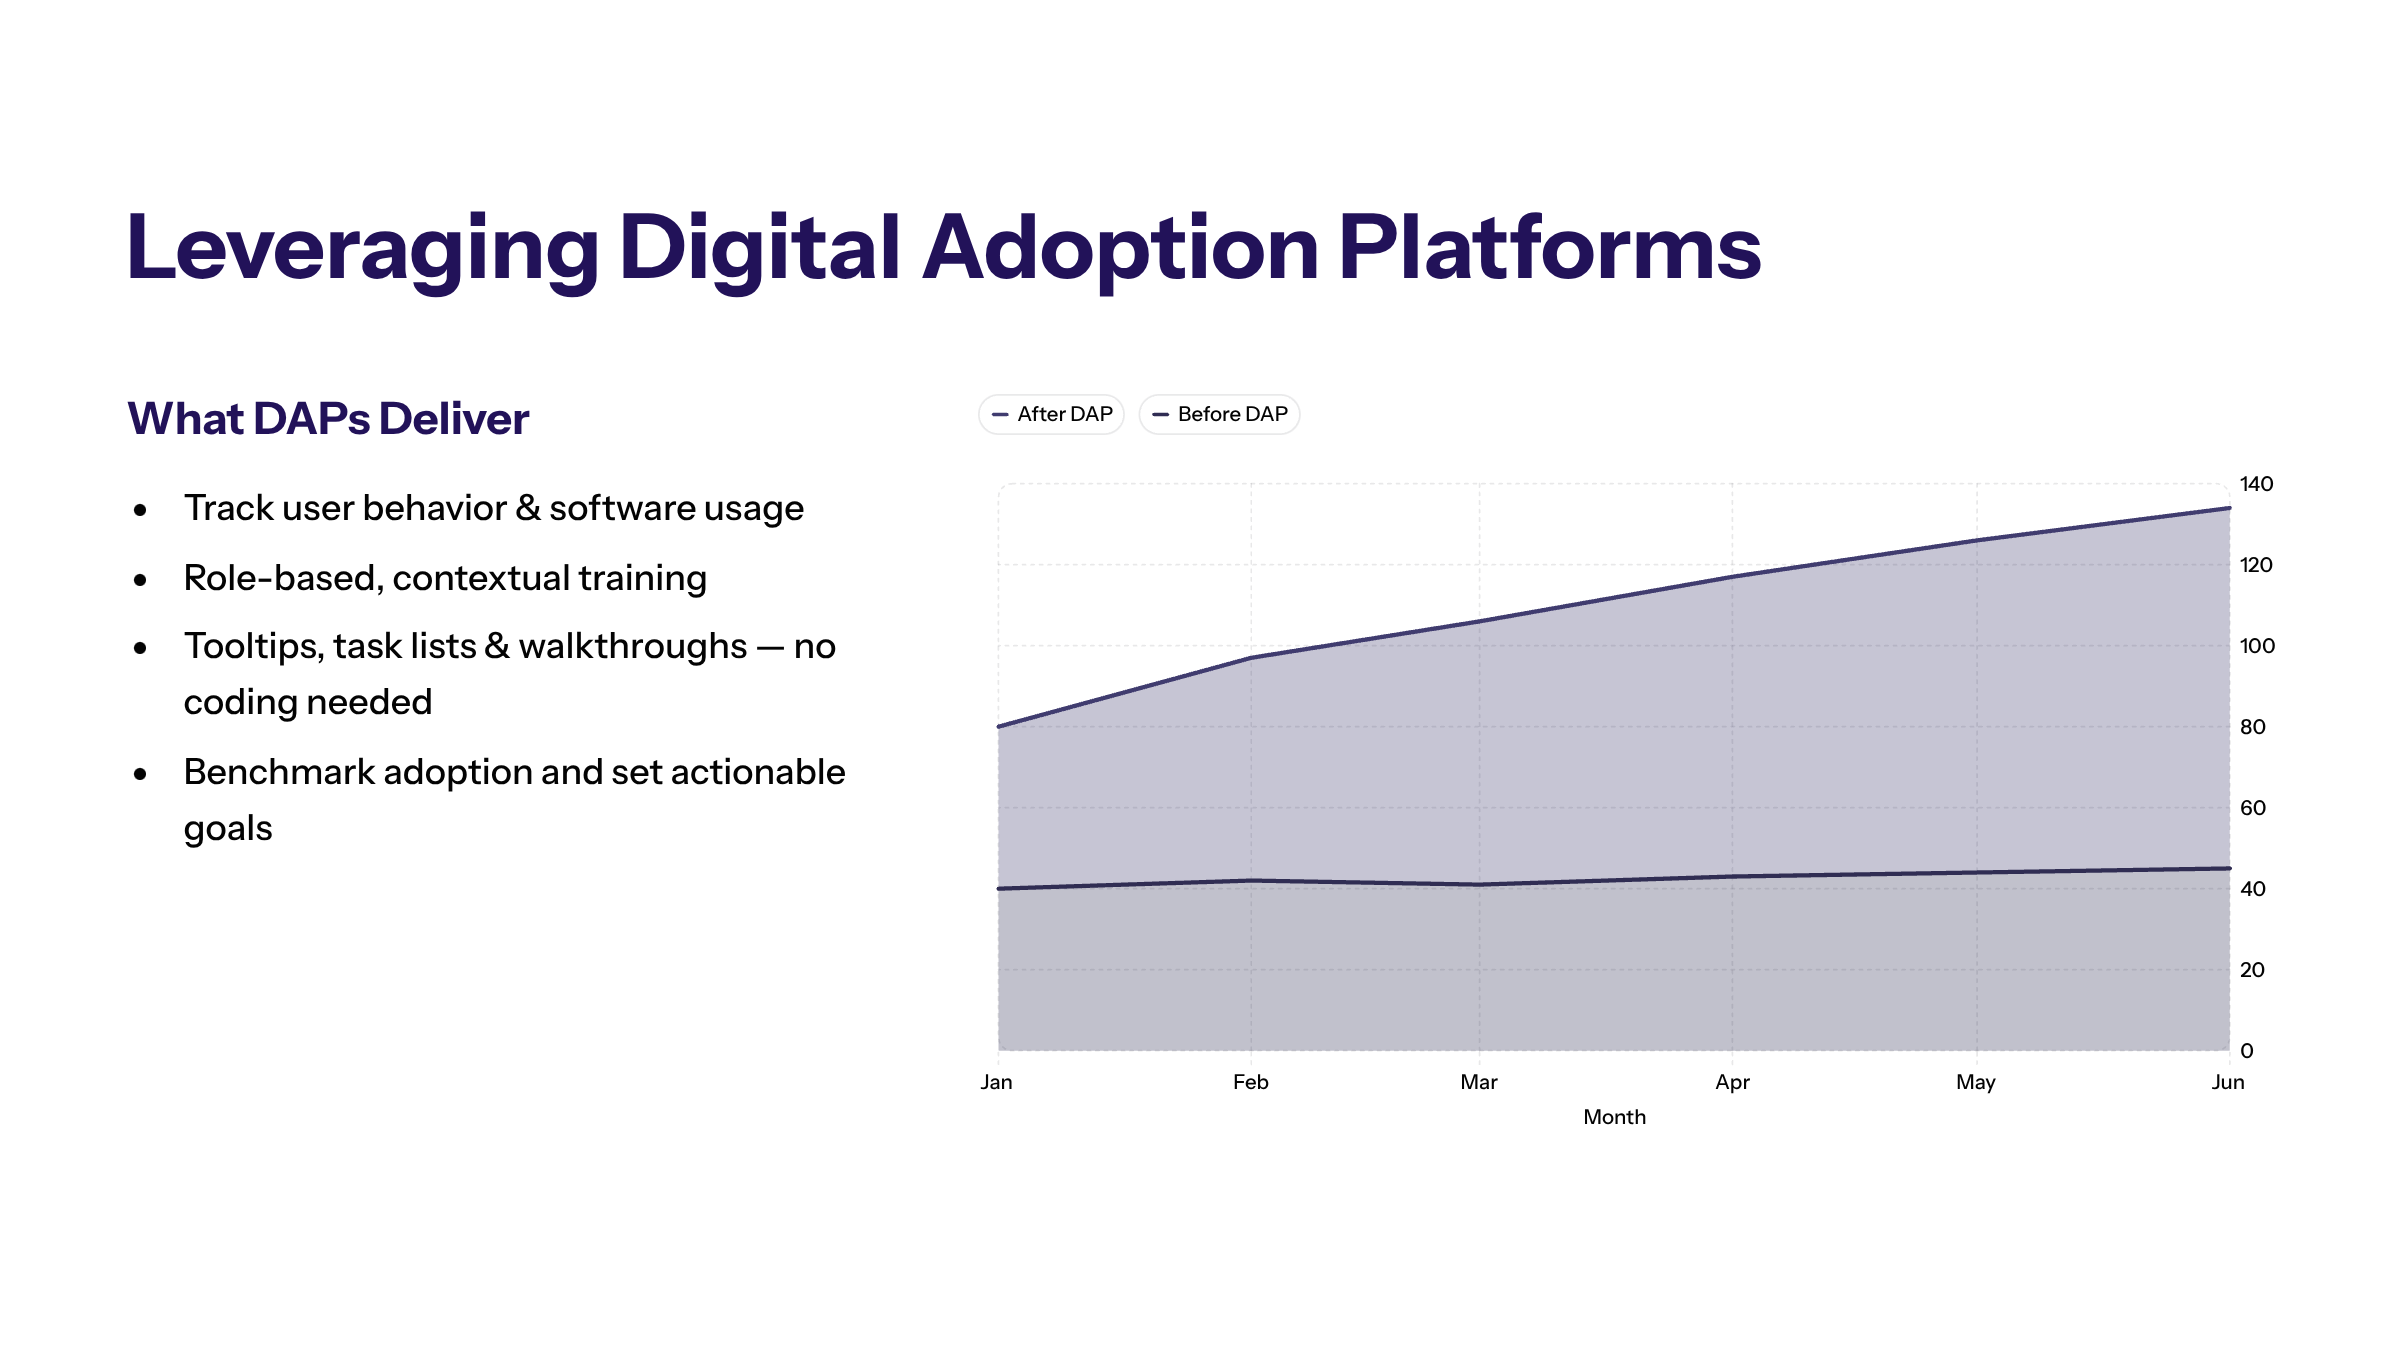
Leveraging Digital Adoption Platforms
Digital Adoption Platforms (DAPs) are invaluable tools for organizations aiming to optimize workflow adoption. They provide analytic capabilities to track user behavior and software usage, streamline the process of tracking product adoption metrics, and enable the creation of contextual, role-based training and support for end-users.
By investing in a DAP, organizations can benchmark their current rate of adoption, set actionable goals, and deploy in-app guidance such as tooltips, task lists, and walkthroughs without requiring technical expertise.
Popular tools like Userpilot, Mixpanel, and Appcues are recommended for measuring and optimizing product adoption, offering deep insights into user engagement and friction points.
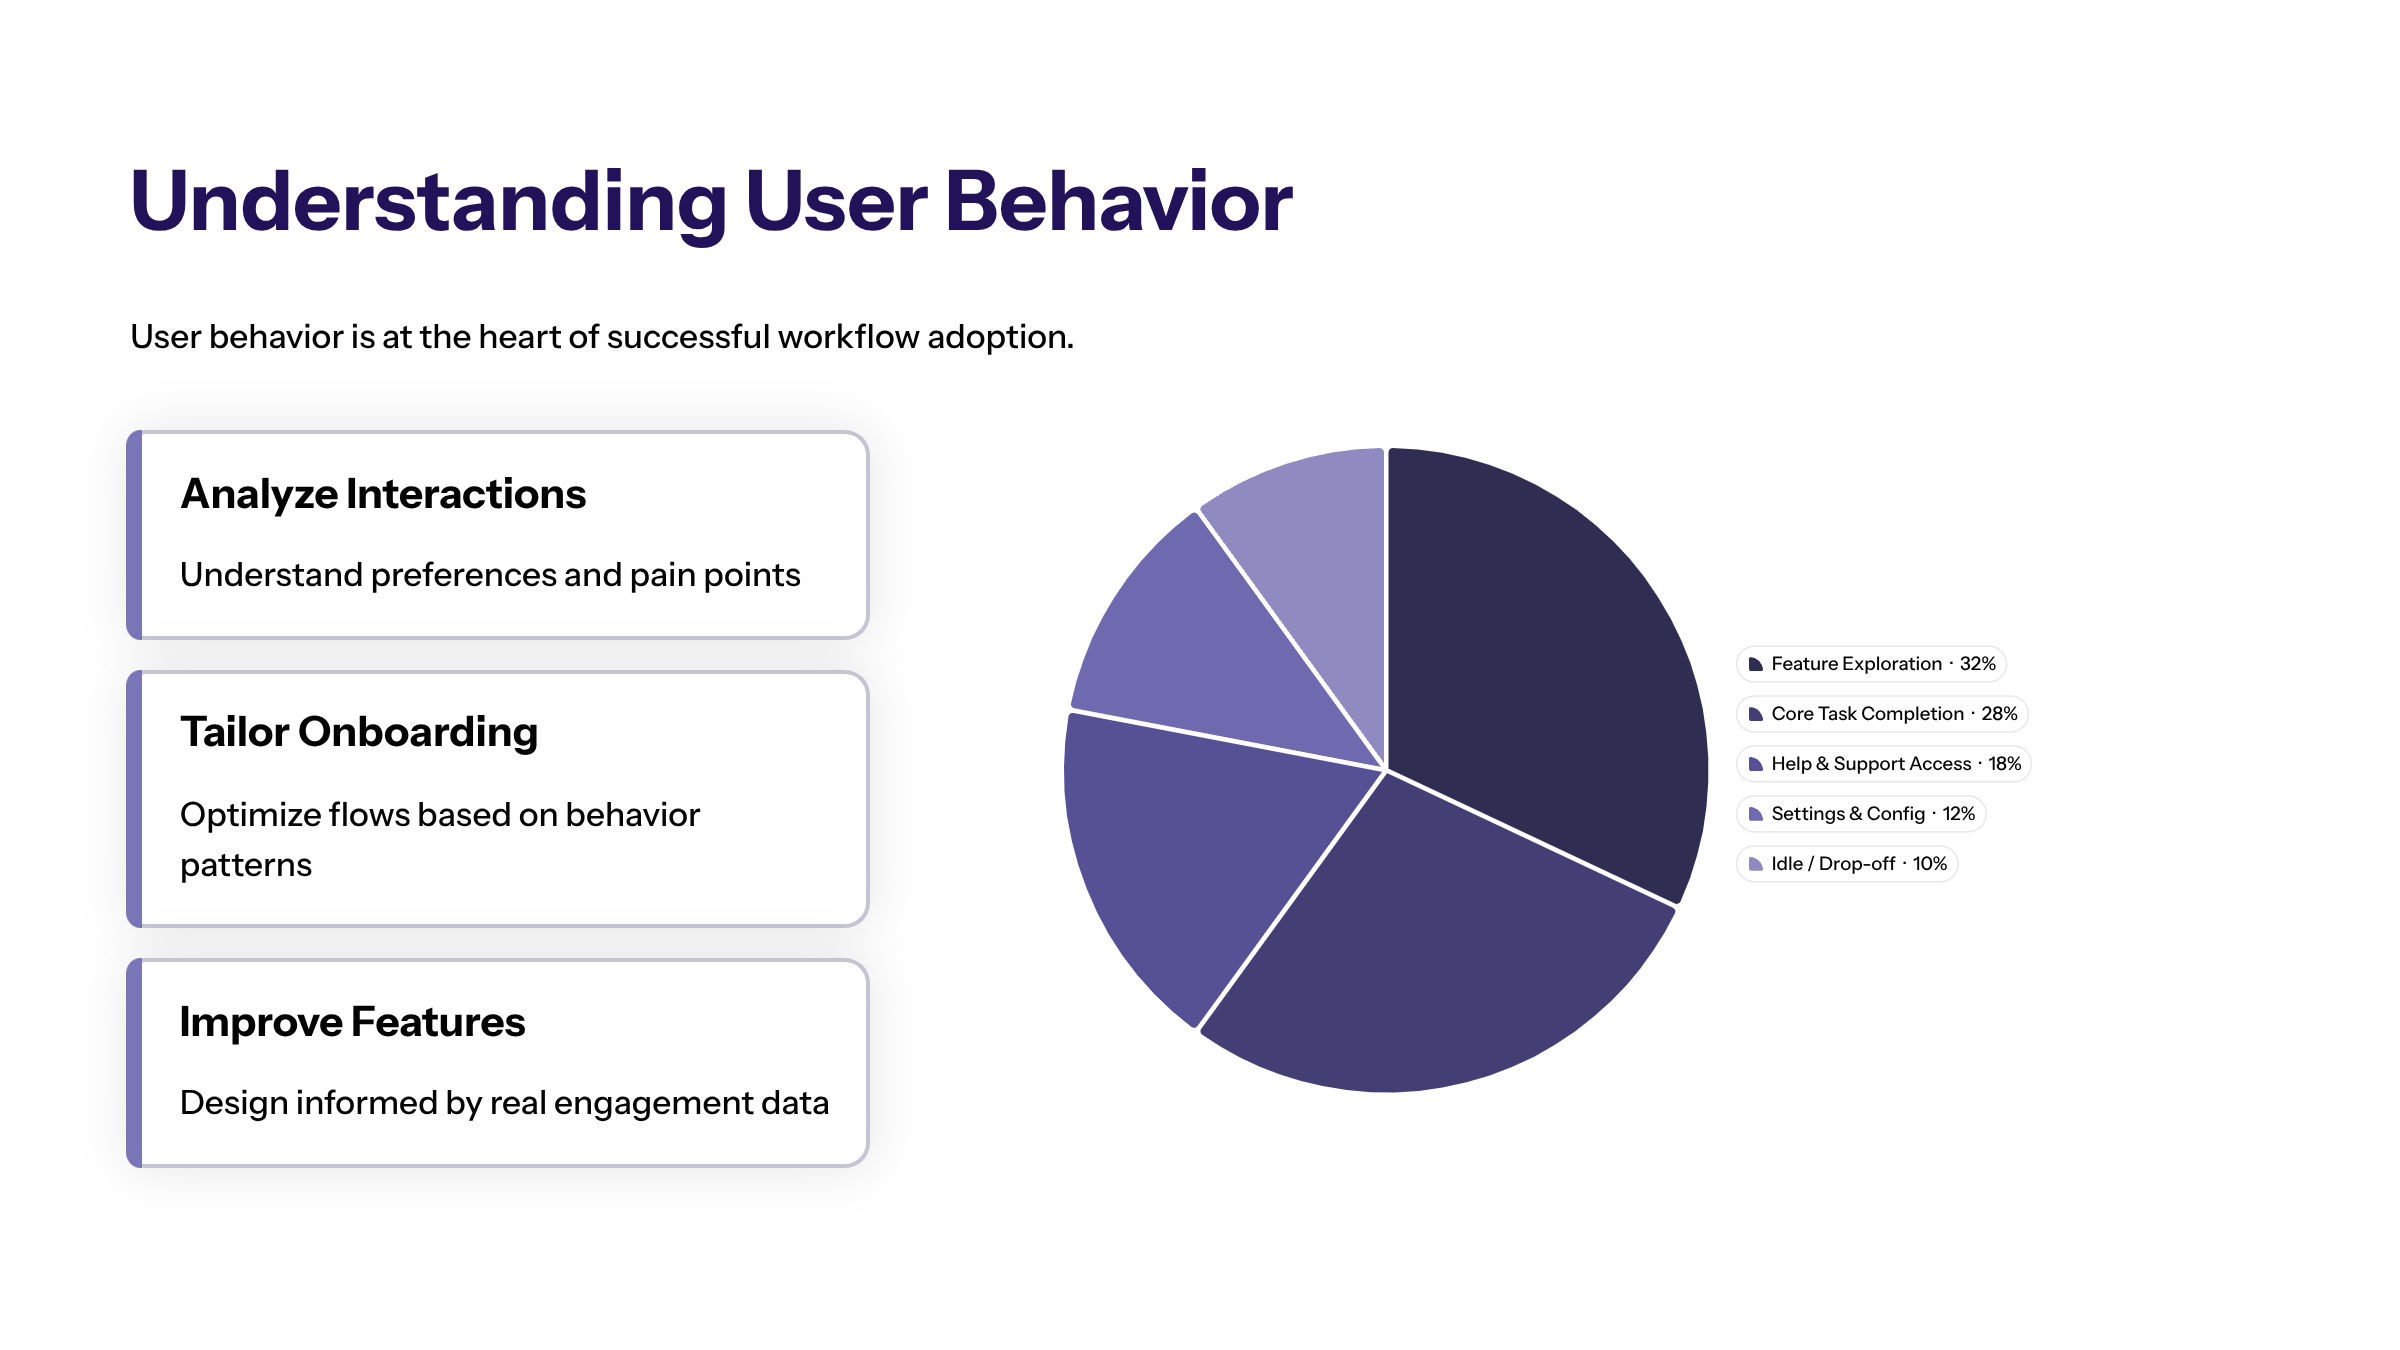
Understanding User Behavior
User behavior is at the heart of successful workflow adoption. By analyzing how users interact with workflows, product managers can gain valuable insights into user preferences, pain points, and engagement patterns. Understanding user behavior enables organizations to tailor onboarding processes, optimize feature design, and improve overall user satisfaction.
Tracking User Behavior
Tracking user behavior involves collecting data on user logs, session duration, and interaction frequency. This data reveals how many users are engaging with workflows, which features they use most, and where they encounter difficulties. Combining quantitative data with qualitative feedback from user surveys and interviews provides a comprehensive view of user experience.
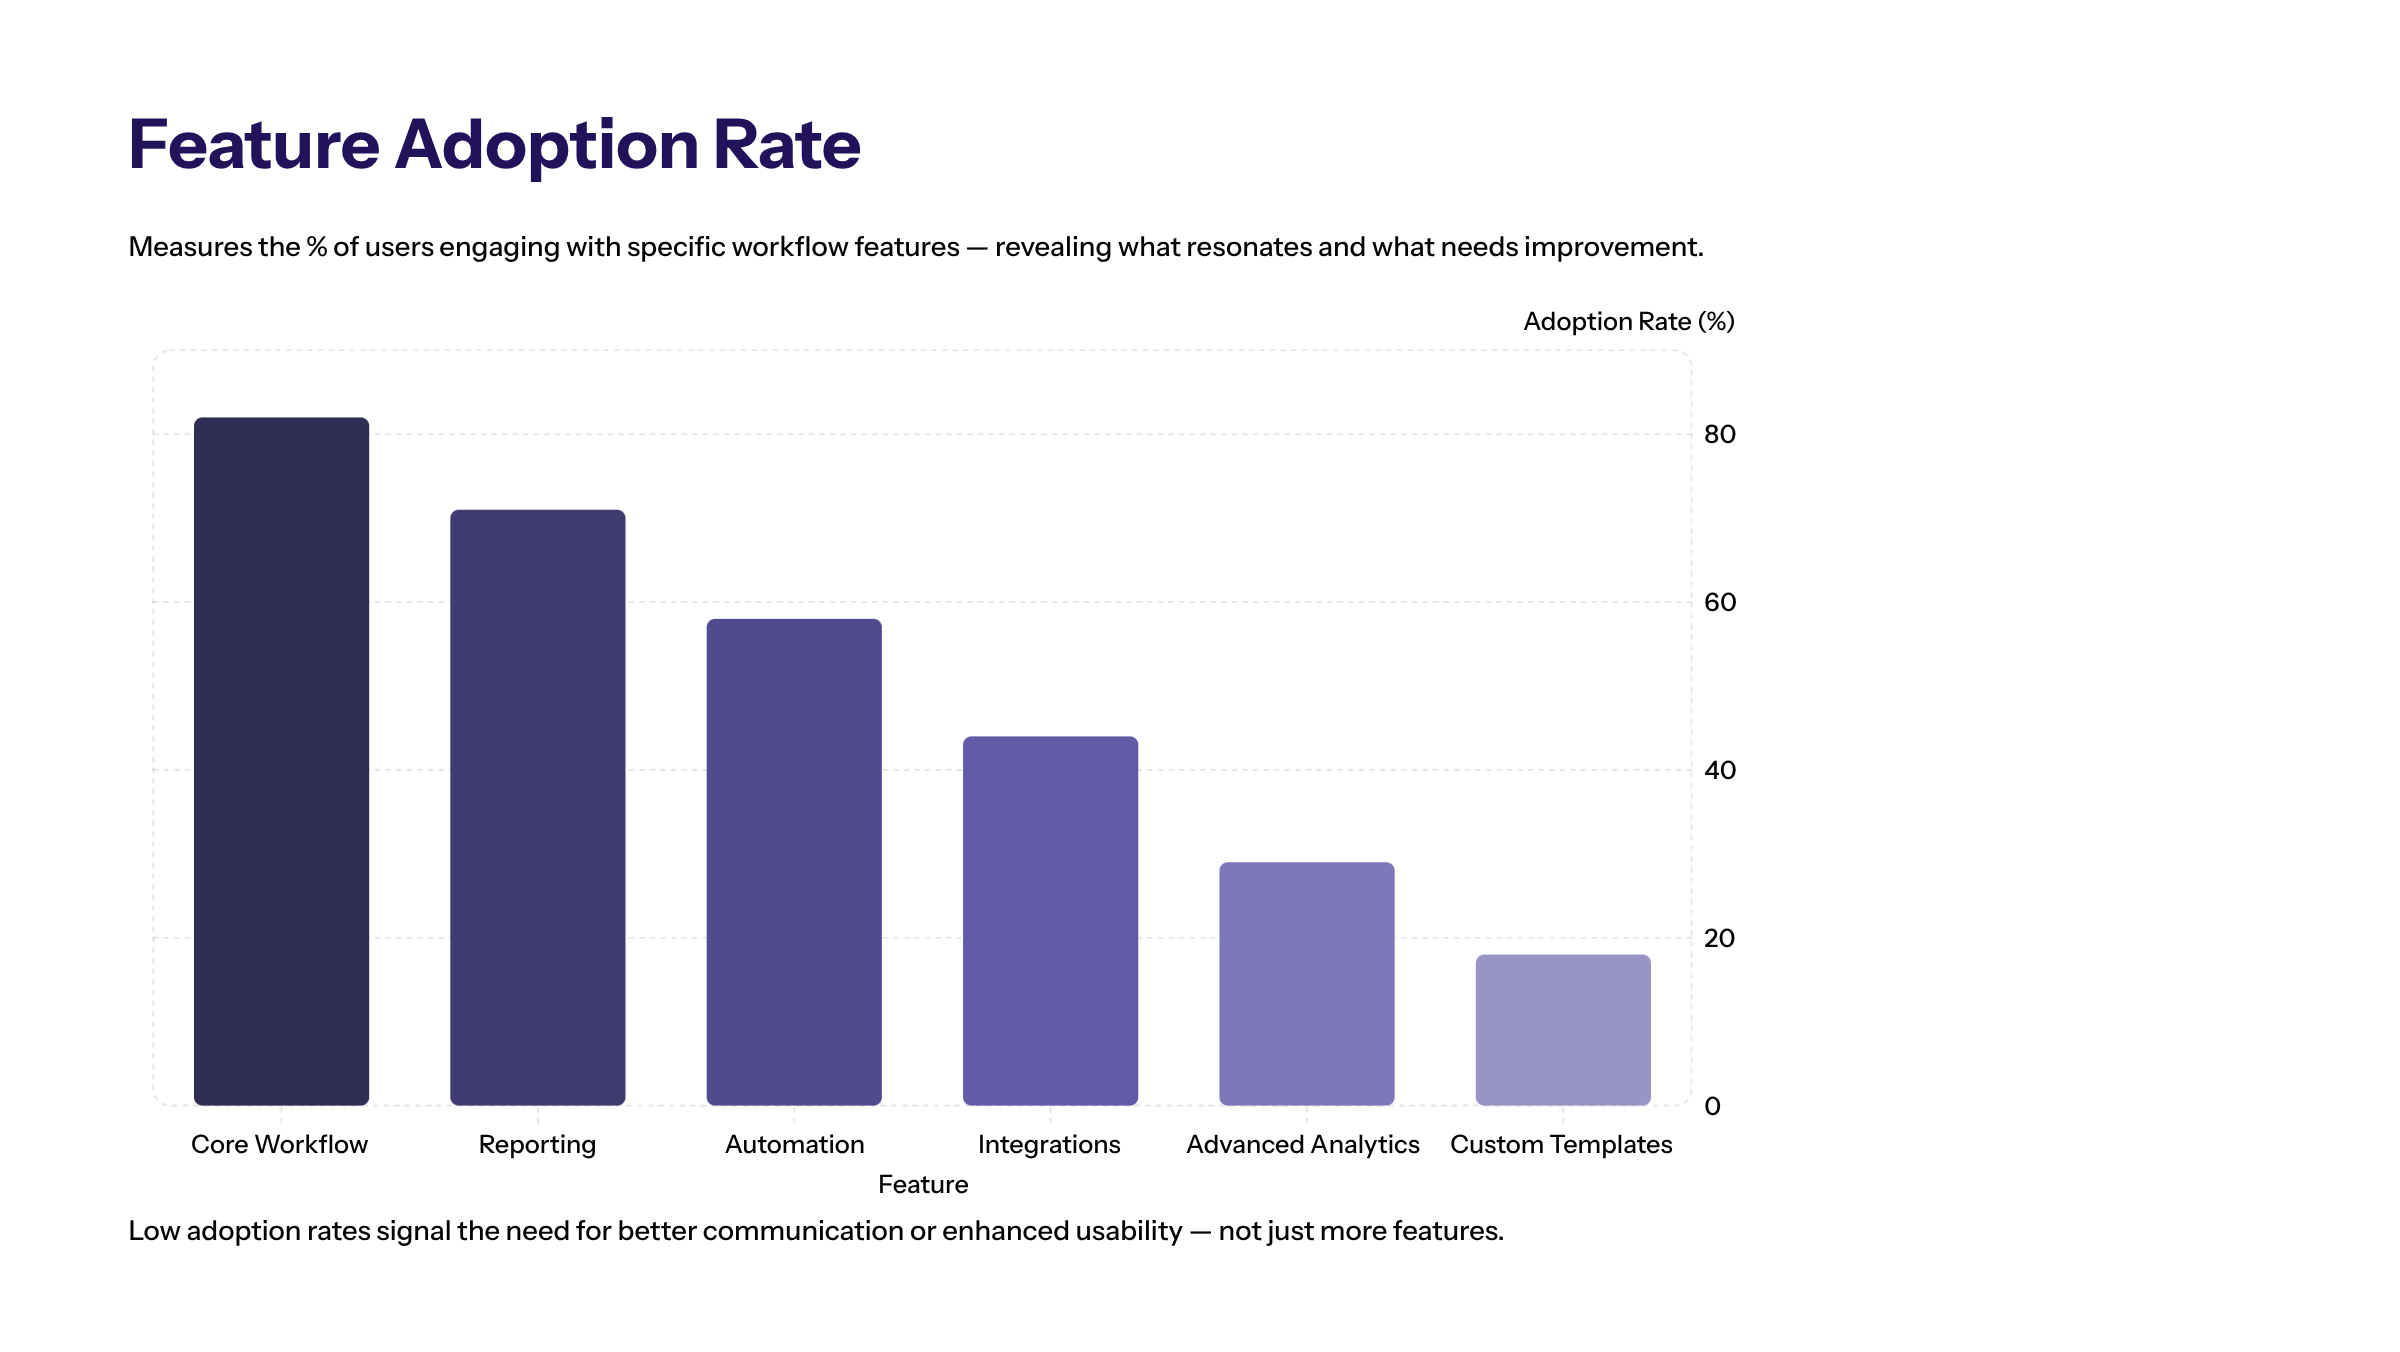
Feature Adoption Rate
Feature adoption rate measures the percentage of users engaging with specific workflow features. It highlights which key features resonate with users and which may require enhancement or better communication.
Importance of Feature Adoption Rate
A high feature adoption rate indicates that users find the features valuable and easy to use, contributing to higher retention and satisfaction. Conversely, a low feature adoption rate may signal usability issues, lack of awareness, or misalignment with user needs.
Improving Feature Adoption
Organizations can boost feature adoption by adding in-app prompts, personalized walkthroughs, and targeted communication about new features. Monitoring feature adoption rate helps identify underutilized features and informs product strategy adjustments.
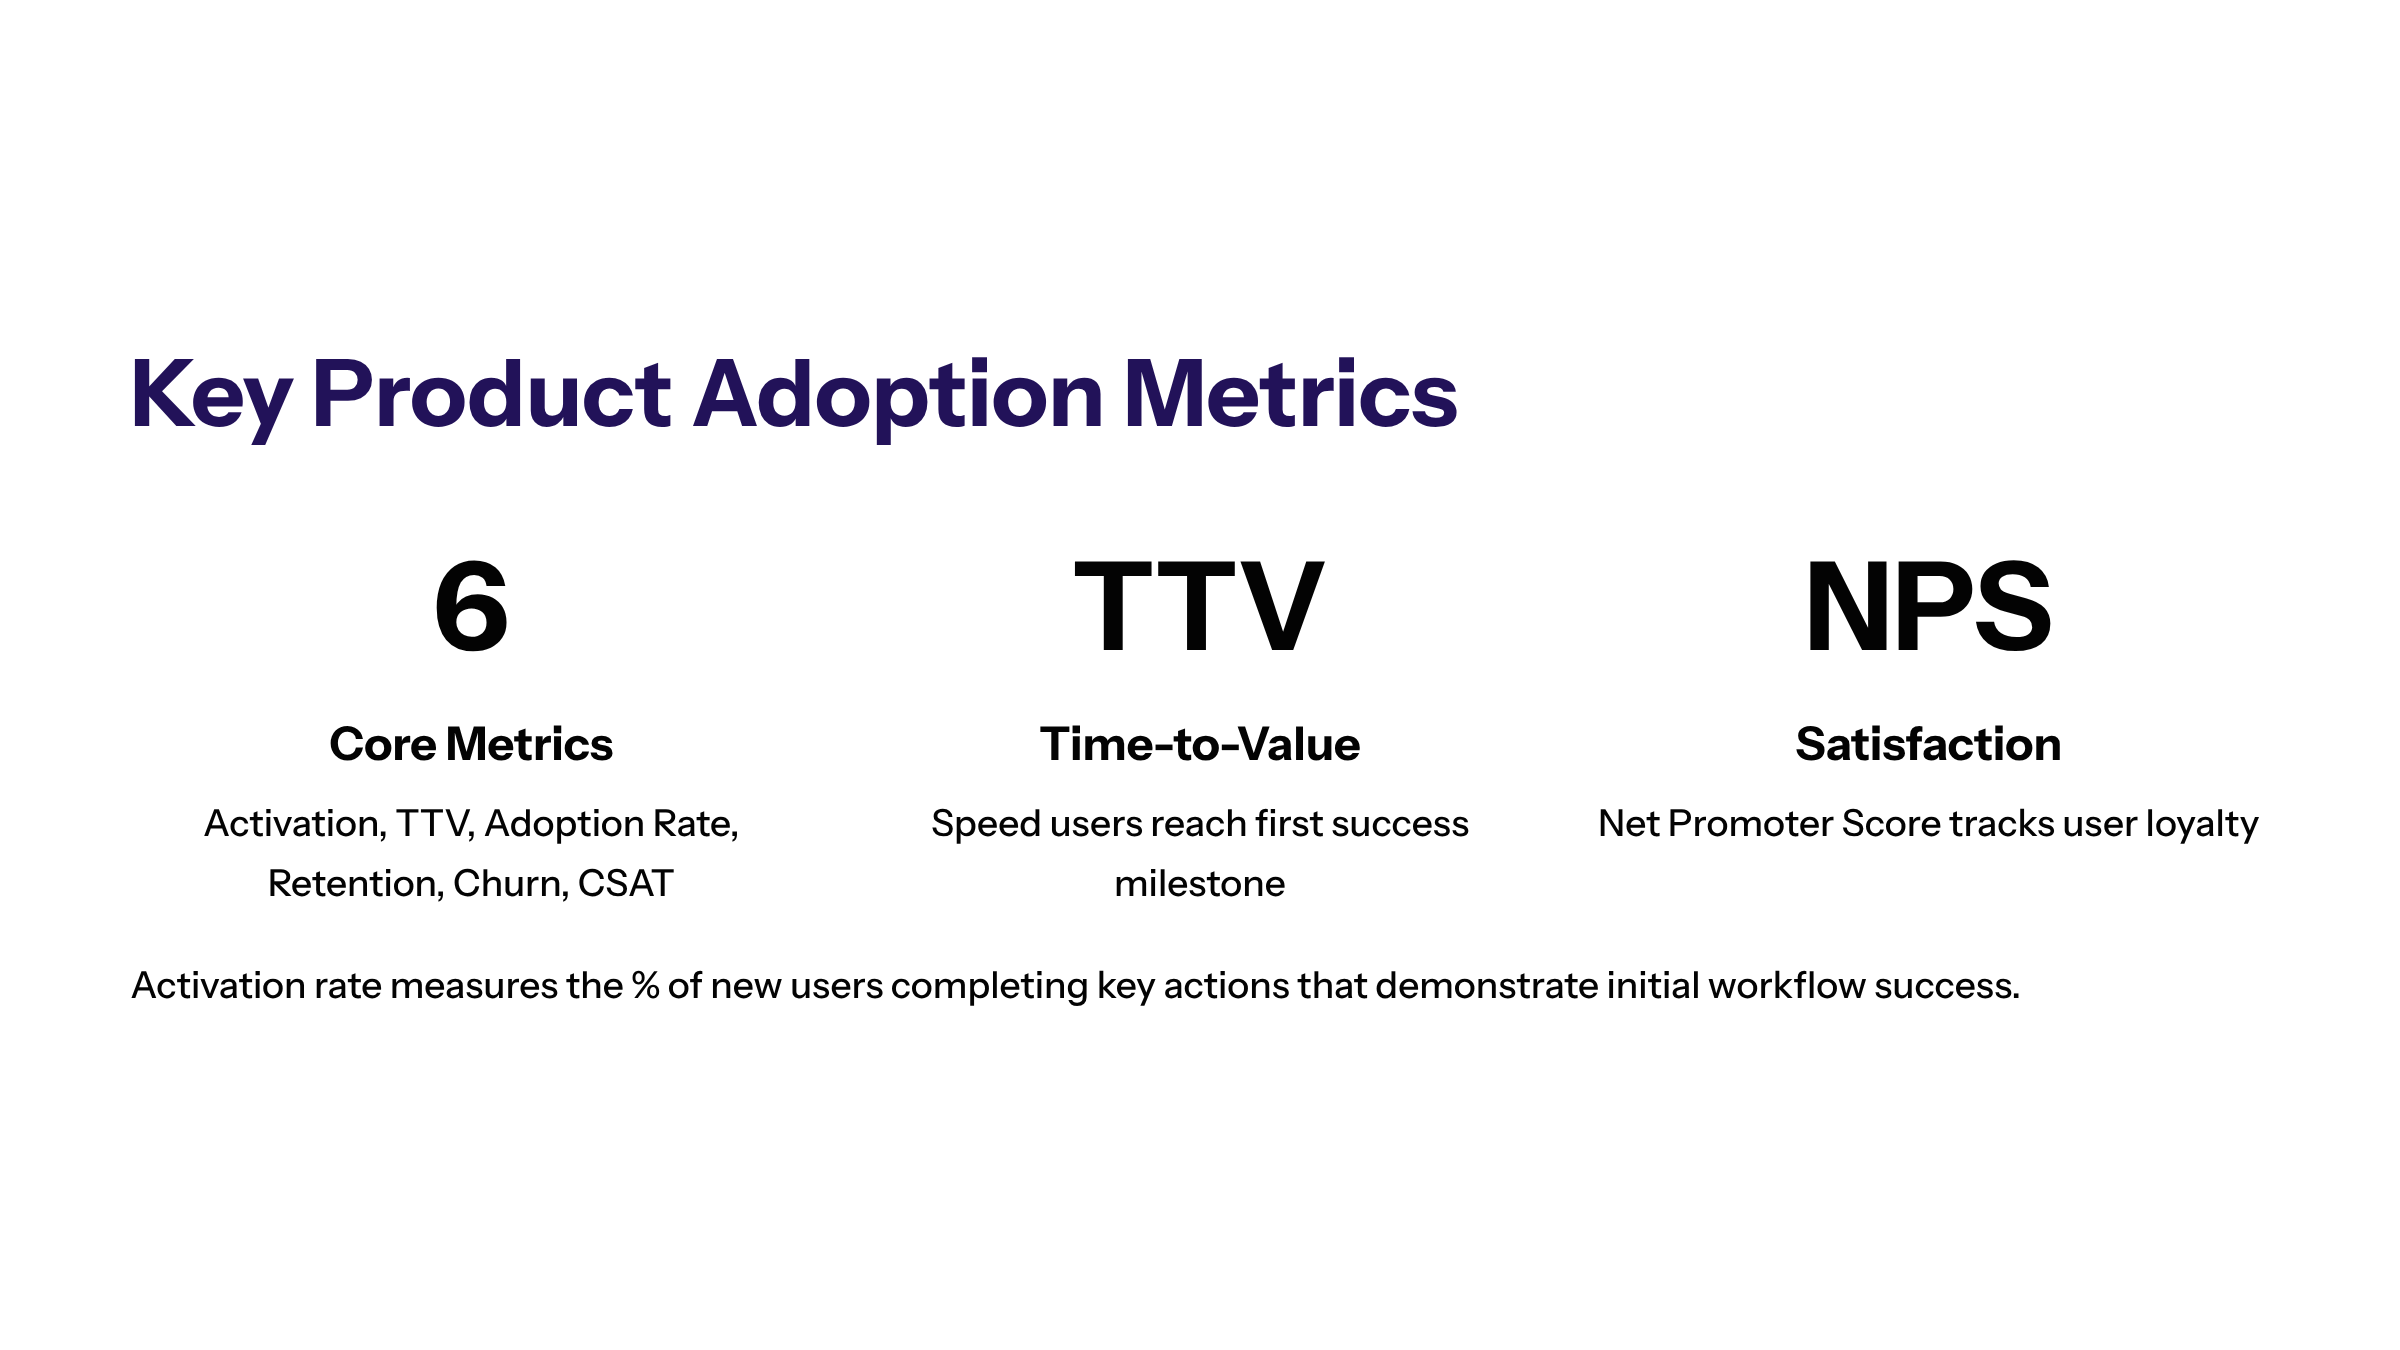
Key Product Adoption Metrics
Tracking key product adoption metrics provides a holistic understanding of workflow success and user engagement. These metrics include activation rate, time-to-value (TTV), user adoption rate, retention rate, churn rate, and customer satisfaction scores.
Activation Rate
Activation rate measures the percentage of new users who complete key actions that demonstrate initial success with the workflow. Improving activation rate involves streamlining onboarding and guiding users to the workflow’s “aha moment.”
Time-to-Value (TTV)
TTV tracks how quickly users experience the core benefits of a workflow. Shorter TTV correlates with higher user satisfaction and retention, emphasizing the need for efficient onboarding processes.
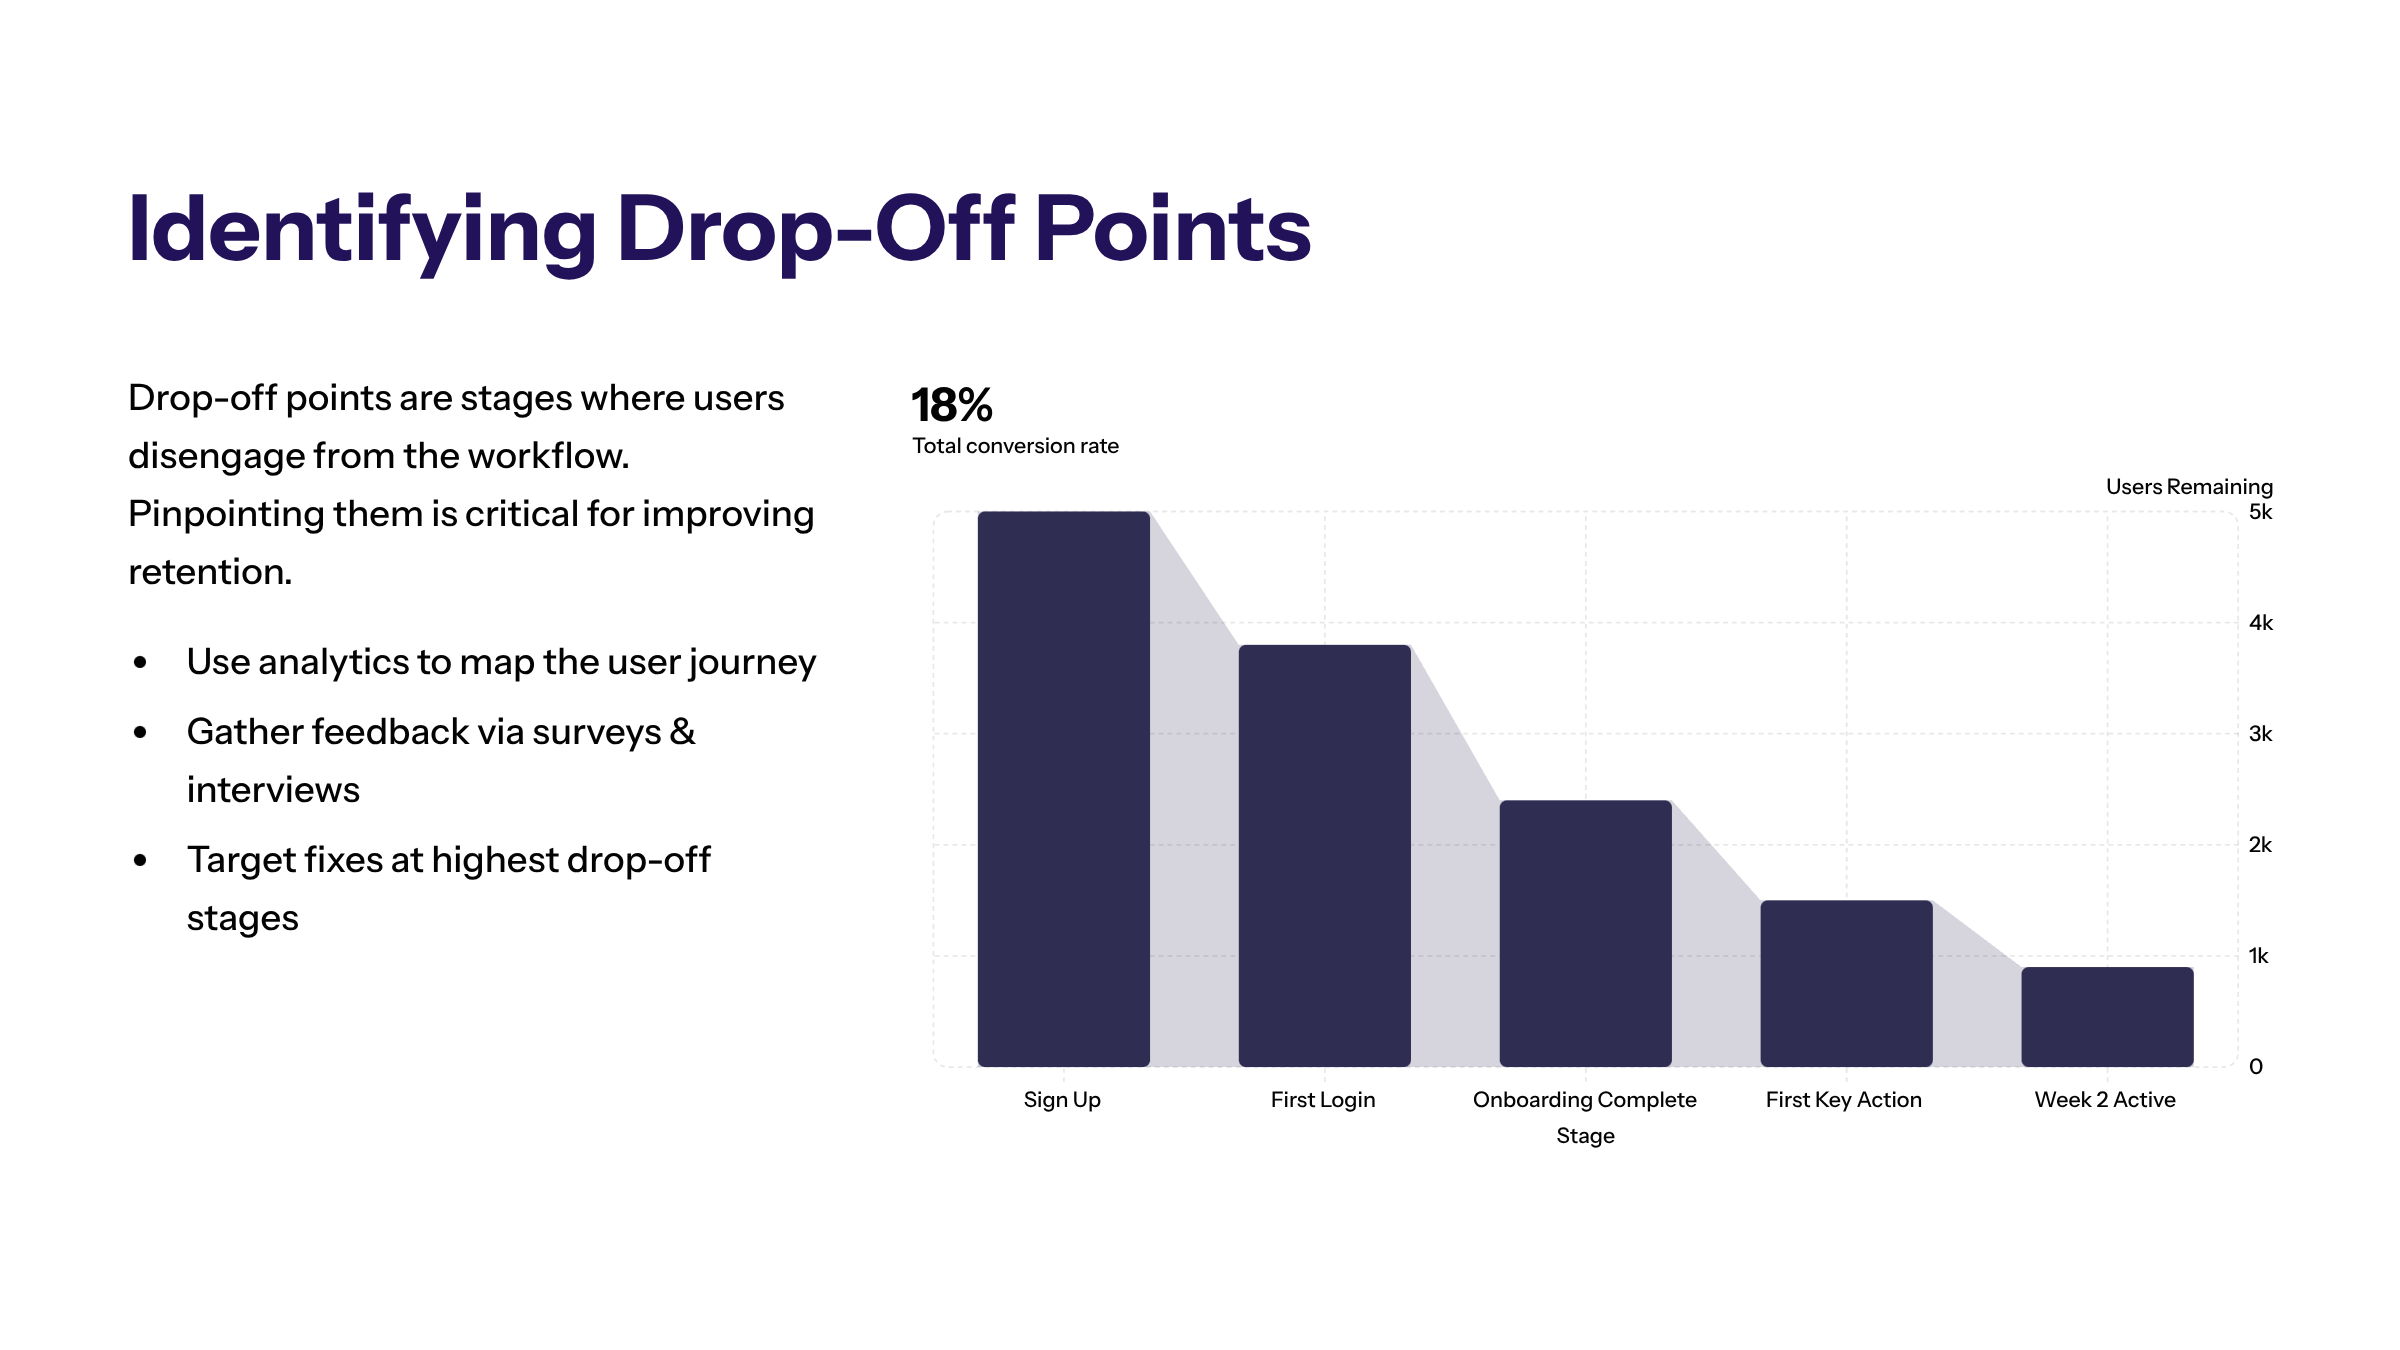
Identifying Drop Off Points
Drop off points are stages in the user journey where users disengage or stop using the workflow. Identifying these points is crucial for improving user retention and adoption.
Analyzing Drop Off Points
Using analytics tools and user feedback, organizations can pinpoint where users drop off during onboarding or feature usage. Common causes include confusing user interfaces, lack of guidance, or unmet user expectations.
Addressing Drop Off Points
Targeted interventions such as in-app prompts, improved UI/UX design, and enhanced user support can reduce drop off rates. Continuous monitoring ensures that changes effectively improve user engagement.
Customer Retention Rate
Customer retention rate measures the percentage of users who continue using the workflow over a defined period. It reflects user loyalty and the ongoing value delivered by the workflow.
Importance of Customer Retention Rate
High retention rates indicate that users find sustained value in the workflow, leading to increased customer lifetime value and business growth. Low retention rates highlight areas needing improvement, such as feature relevance or user experience.
Strategies to Improve Retention
Improving retention involves enhancing user engagement through personalized onboarding, regular feature updates, and responsive support. Collecting user feedback and monitoring retention metrics help tailor strategies to user needs.
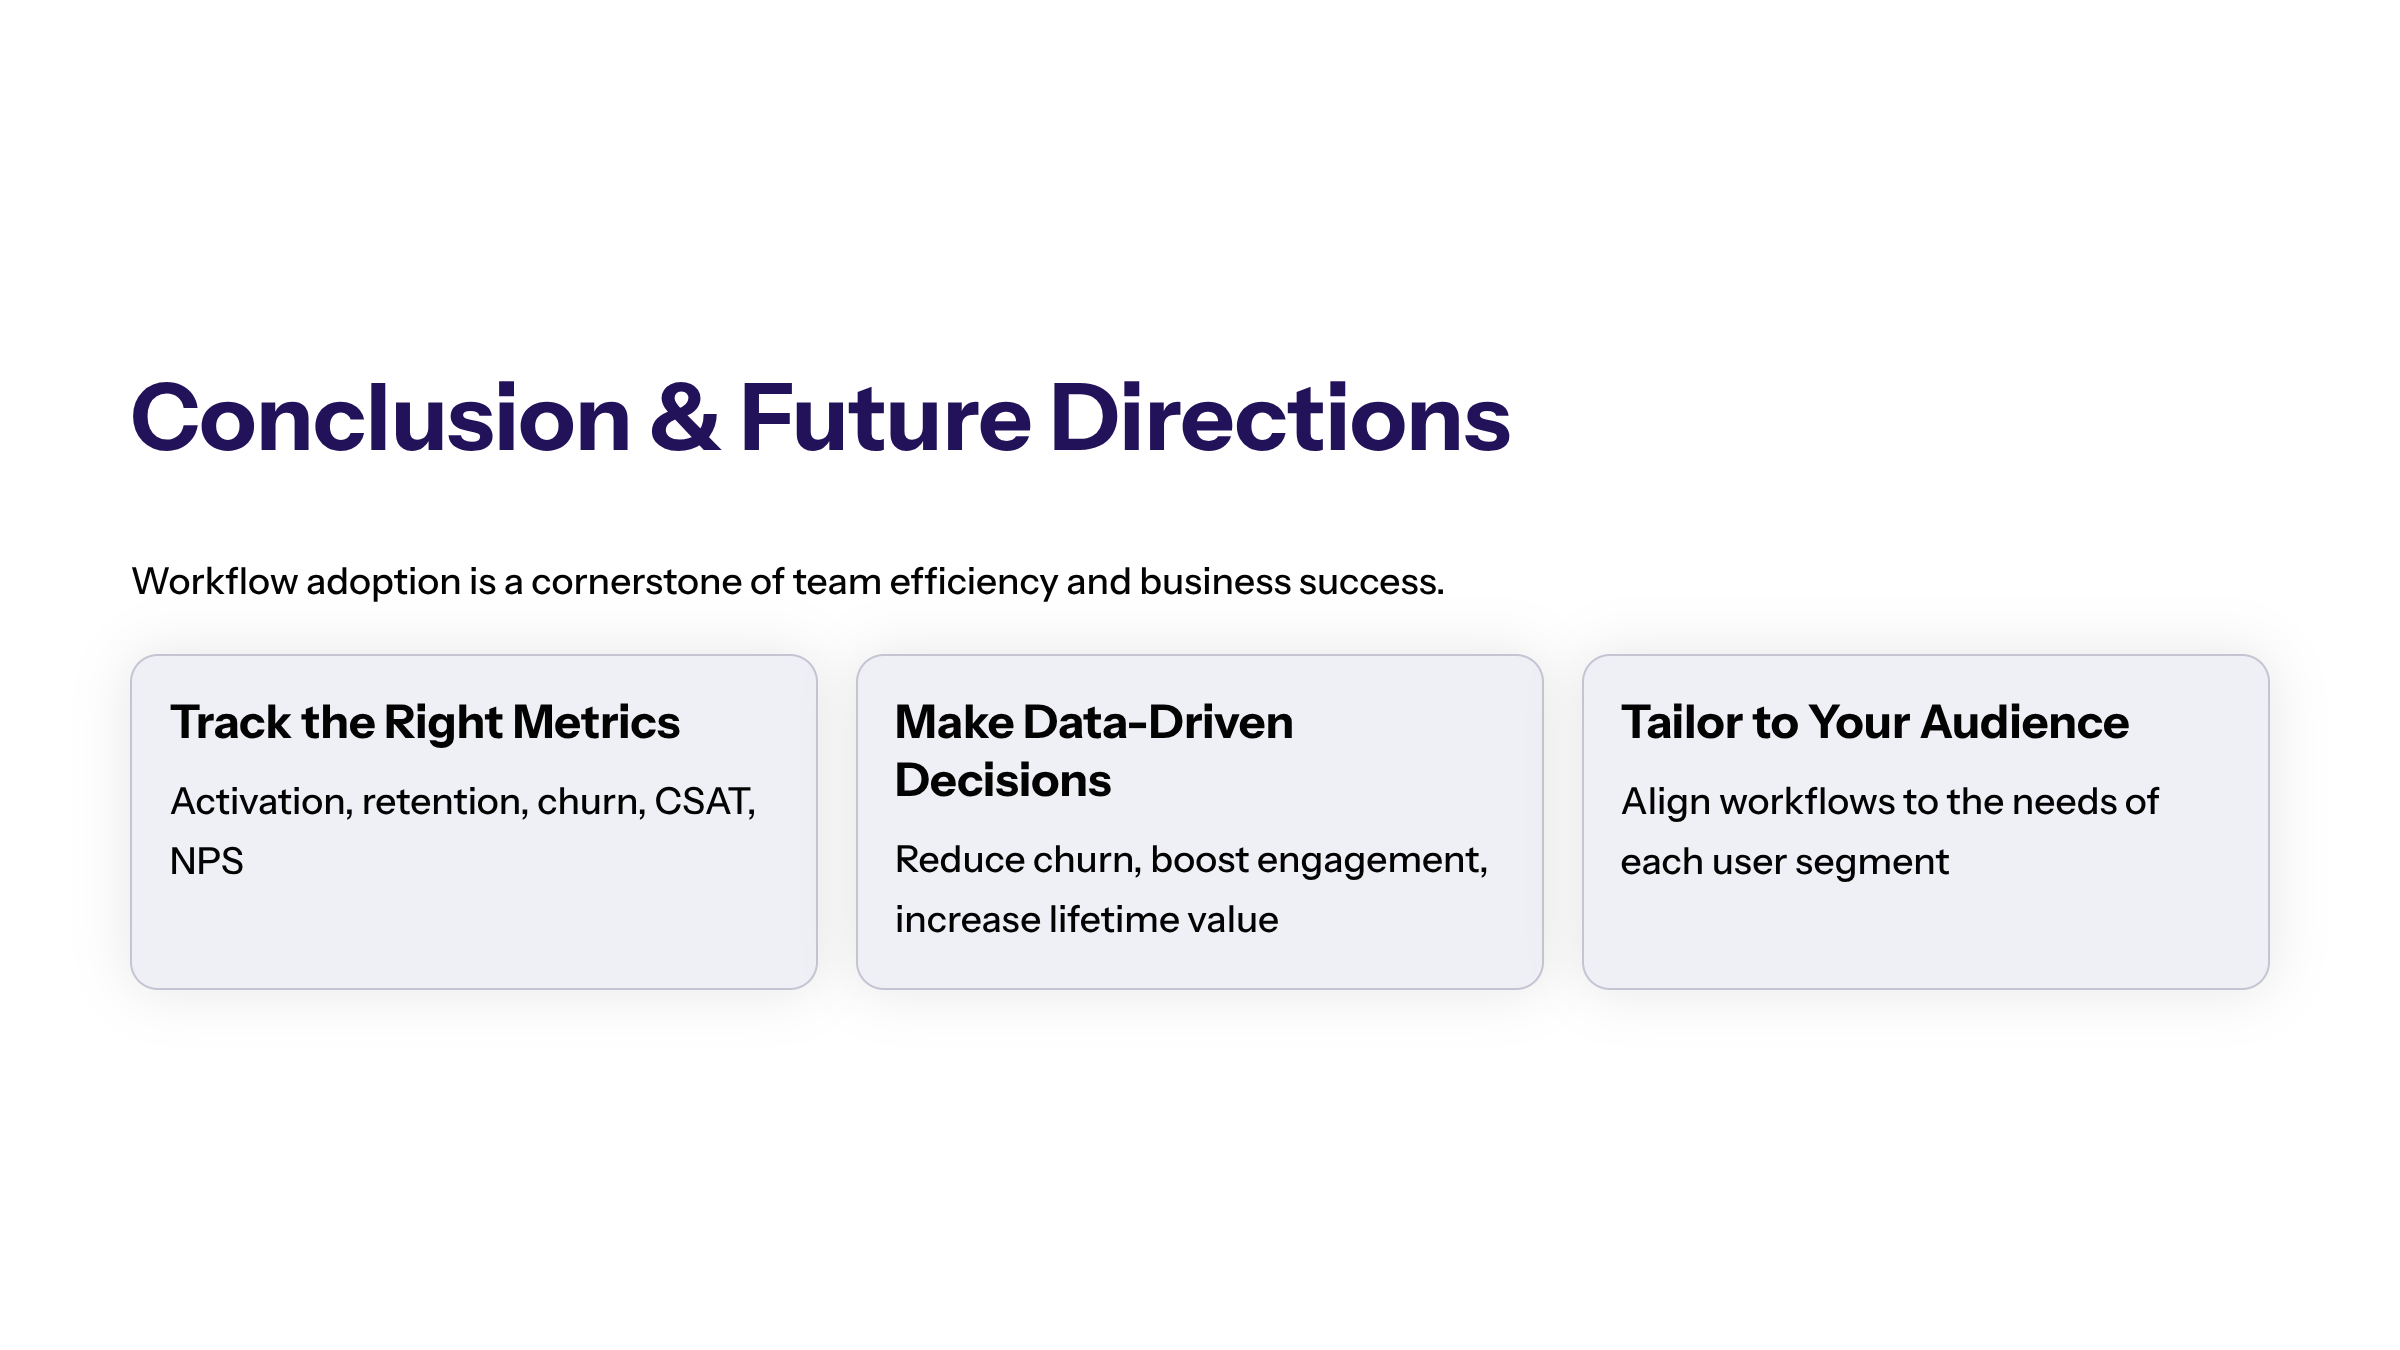
Conclusion and Future Directions
Workflow adoption remains a cornerstone of team efficiency and business success. By understanding and tracking key adoption metrics to track, organizations can make data-driven decisions that enhance user engagement, reduce churn, and increase customer lifetime value.
Selecting the right metrics to track is essential for gaining actionable insights into engagement and retention rates, helping teams tailor workflows to better meet the needs of their target audience. Moreover, effective workflow adoption supports customer acquisition by turning new users into satisfied customers who find ongoing value in the product.
Looking ahead, leveraging AI and machine learning to analyze user behavior and personalize workflows will further empower organizations to optimize adoption strategies. Continuous monitoring and adaptation of these adoption metrics to track will ensure workflows remain aligned with user expectations and evolving business needs.
Effective workflow adoption is not just about technology deployment but about fostering user loyalty and delivering sustained value that drives organizational growth.