
Make the Numbers Traceable to the Work They Describe
A dashboard is only useful when people understand what its numbers mean. Conflicting definitions, disconnected source systems, and manual reconciliation can leave teams debating the report instead of acting on it.
Cognativ starts with the decisions the information must support. We trace the relevant data from its source through transformation and reporting, establish how it will be checked, and define who owns the resulting measures. That foundation supports both everyday reporting and new data products.
Business evidence
Business evidence
Research brings together source records, customer feedback, and conversations with the people behind the numbers. Connect that evidence to the outcome the business needs.
Relevant findings
Relevant findings
Analyze separates useful information from noise and tests the explanations behind reported results. Where findings expose gaps, return to Research to resolve them.
A defined problem
A defined problem
Use the findings to identify what needs to change and why. For data and analytics, that means tracing conflicting measures to their sources, definitions, and the work they describe.
Evidence for action
Data Services from Source Systems to Business Use
Start with a reporting problem, an integration requirement, or a data product you want to develop. The scope connects the information needed with the technical work and operating responsibilities required to keep it useful.
Data Strategy and Assessment
- Data Priorities
- Source Inventory
- Business Use
Identify the business decisions, processes, and products that depend on better information. We map relevant sources and examine their quality, availability, and ownership. The assessment establishes priorities for data work, with each proposed investment tied to a defined use.
Data Integration and Pipelines
- Ingestion
- Transformation
- Reconciliation
Bring information from separate systems into a consistent, maintainable flow. We define ingestion, transformation, reconciliation, and exception handling around the requirements of the consuming application or report. Pipeline behavior and ownership remain visible when a source changes or a load fails.
Data Architecture and Modeling
- Architecture
- Data Models
- Freshness
Structure data so it can support the required queries, relationships, and access patterns. We examine storage, analytical models, and the connections between operational and reporting systems. Design decisions account for freshness, scale, and the team that will maintain the environment.
Business Intelligence and Reporting
- Metrics
- Dashboards
- Decision Support
Develop reports and dashboards around the questions teams need to answer. We agree on metric definitions, relevant comparisons, and the level of detail users need to investigate a result. Validation against source records helps establish confidence before a report becomes part of regular decision-making.
Data Quality and Governance
- Quality Checks
- Ownership
- Access Rules
Make data responsibilities and checks part of the operating process. We define ownership, access rules, and validation for the information in scope, with a clear process for investigating discrepancies. The work connects governance decisions to the pipelines, reports, and applications they affect.
Data Products and Analytics Delivery
- Data Products
- APIs
- Consumer Needs
Package information for a defined audience through applications, APIs, or analytical services. We connect the commercial or operational use with data preparation, permissions, and delivery requirements. The scope includes how consumers access the product and how its information remains current and supportable.
Data Foundations with a Defined Business Purpose
For a healthcare payer, Cognativ connected de-identified claims data with normalized ingestion, APIs, dashboards, and product tiers to support a data-broker offering.
In a separate engagement, Cognativ helped a data aggregator align collection, permission controls, and marketplace outputs. Both projects connect the handling of information with the way the business intends to use and deliver it.
Healthcare Data: 20x Exit Valuation
Data Platforms
API Development
Data Integration
Data Marts
Healthcare Data: 20x Exit Valuation
Cognativ helped a traditional third-party payer reposition from a claims-processing service provider into a strategic healthcare data broker.
The transformation reshaped the company’s go-to-market model and increased exit valuation by 20x.
See the 20x Exit Story
Data Platform Reaches 75% Category Market Share
Data Platforms
Data Aggregation
Data Management
Technology Strategy
Data Platform Reaches 75% Category Market Share
Cognativ helped reposition a data management offering around a clearer market category, stronger operational narrative, and more defensible growth strategy.
The repositioning helped the business establish 75% market share in an emerging category while clarifying its value for enterprise buyers.
Explore the Data Category WinRAPID Turns Data Questions into Working Capabilities
We manage data engagements with RAPID: Research, Analyze, Plan, Implement, and Decide, developed by Cognativ founder Ali Davachi. The method keeps data engineering connected to business meaning, user review, and the decisions the information must support.
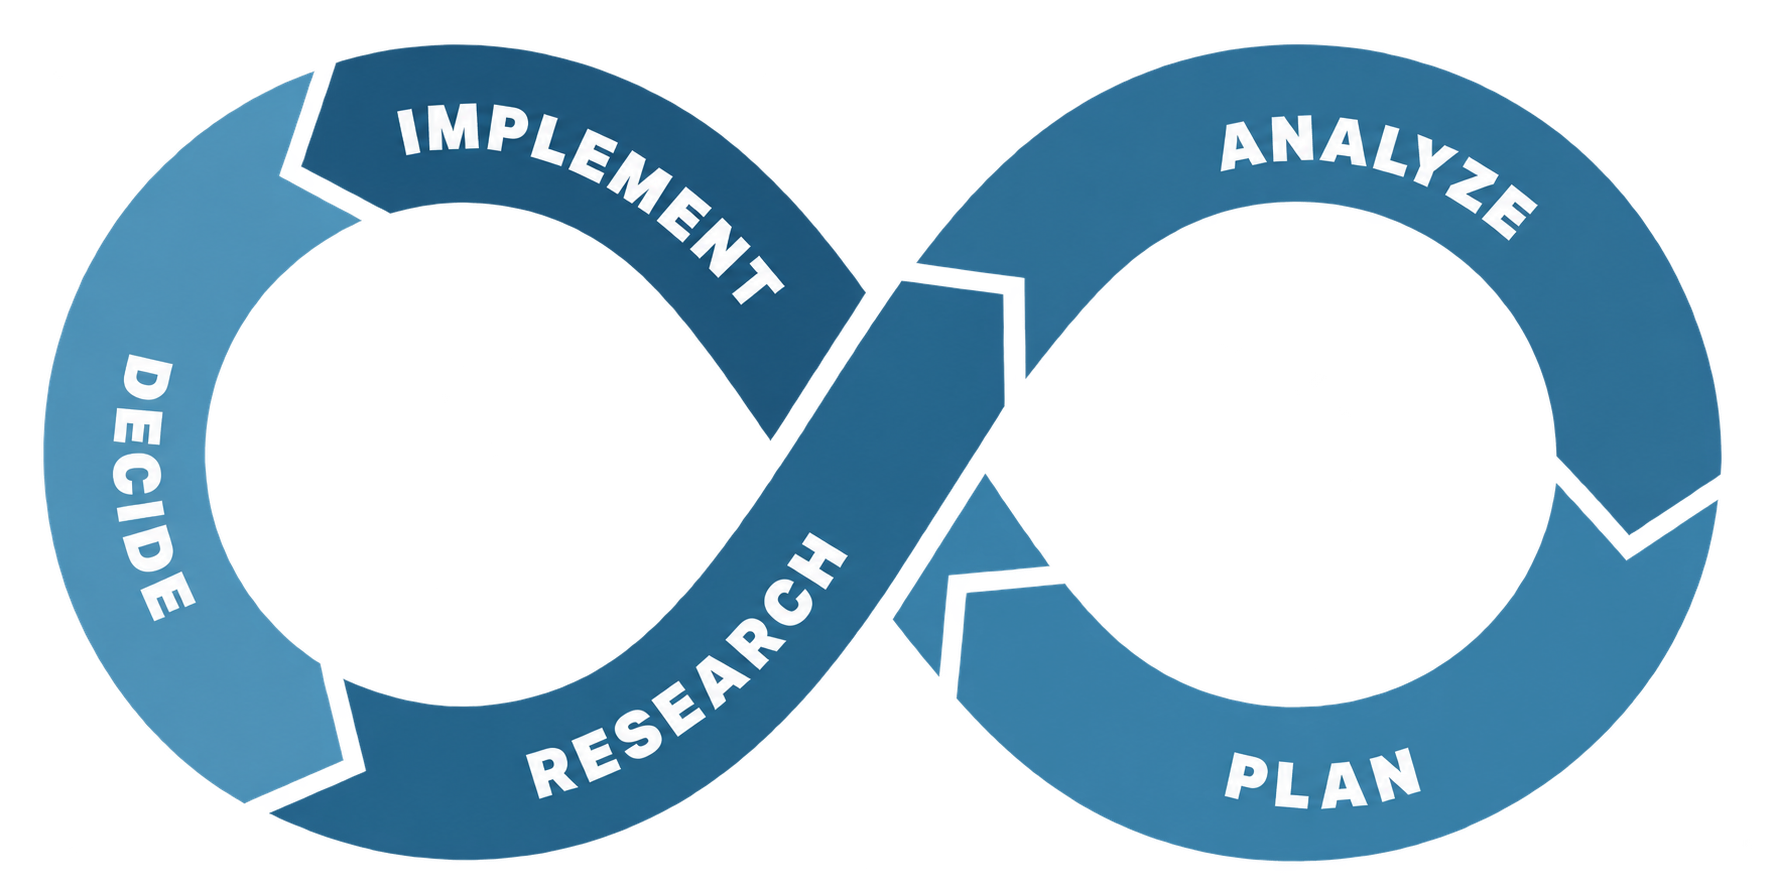
Research and Analyze: Trace the Question to Its Sources
Clarify the business question and examine the records, definitions, and transformations behind the current answer. Identify discrepancies, access constraints, and missing ownership. Use those findings to establish the work required for a dependable result.
Plan, Implement, and Decide: Validate the Information in Use
Build the agreed pipelines, models, and reporting with explicit checks and accountable owners. Review the output with the people who understand the source records and those who need the answer. Resolve differences and use the findings to decide which capability to extend next.
Agree on the Question, the Measure, and Its Owner
Data work needs a shared definition of the result before it needs a larger dashboard. We establish the intended decision and then connect it with the sources, validation, and responsibilities required for delivery.
Define the Business Answer
Identify the reporting audience, the question to answer, and the measures involved. Agree on definitions, reporting frequency, and the source records that can establish whether the result is correct.
Connect Data Delivery with Ownership
Confirm source access, transformation responsibilities, and the people who will approve the output. Define how refresh failures and discrepancies will be investigated after the pipeline or report enters use.
From a Data Question to a Defined Engagement
Use the first conversations to explain the reporting gap or data opportunity. We establish a focused scope that connects the business answer with the work needed to produce it.
-
Book
Share the reporting question, data issue, or product opportunity.
-
Discovery Call
Discuss source systems, metric definitions, and the people using the data.
-
Feedback Call
Review the proposed data scope, validation approach, and dependencies.
-
Agreement
Confirm the outputs, source access, ownership, timing, and engagement fees.

Discuss Your Data and Reporting Needs
Tell us which business questions are difficult to answer with your current data. Your first consultation is free.
Describe the source systems, reporting process, and the people who rely on the results. We will explore where a focused data engagement can help.
Data and Analytics Consulting Questions
Understand the data, decisions, and responsibilities that shape an engagement.
Can we begin with one report or business question?
Yes. A focused question can establish which sources, definitions, and transformations matter. It provides a concrete starting point for improving the data foundation without committing to a company-wide redesign.
Can you use our existing reporting tools?
We assess the tools already in place alongside their data connections and the needs of the reporting audience. The work may extend the existing setup or identify specific limitations that require a different approach.
How do you address conflicting numbers across reports?
We trace each measure to its definition, source records, filters, and transformations. That comparison helps distinguish a legitimate difference in business meaning from a data-quality or reporting defect.
Do we need a data warehouse before we can improve reporting?
The architecture should follow the reporting and analytical requirements. We assess source access, data volume, refresh needs, and the relationships between datasets before recommending the storage and modeling approach.
What does data governance include in an engagement?
For the information in scope, we define ownership, permitted access, validation responsibilities, and the process for resolving issues. These decisions are implemented in the relevant data flows and reporting practices.
Can this work prepare data for an AI application?
Yes. Source quality, accessible information, consistent definitions, and clear permissions can support an AI use case. The AI application still needs its own task definition and evaluation criteria; the data scope is shaped by those requirements.
How are reports and pipelines handed over?
The delivery scope identifies the people who will operate the pipelines and use the outputs. Handover covers definitions, data flows, refresh behavior, and the agreed procedures for checking and resolving problems.
What affects the cost of a data engagement?
The number and condition of source systems, access requirements, transformations, validation effort, and delivery format all affect the work. We use the initial assessment to define the scope and discuss fees before agreement.