Process Mapping Template: Fields, Map Types and How to Create a Process Map
Map any process as a step register first: role, decision, condition, next step and record for every row, then draw it as a flowchart, swimlane or BPMN model.
A process mapping template gives a team one agreed place to record how a piece of work moves: who acts, in what order, which questions send it down a different path, and what evidence each step leaves behind. Most free templates are drawing canvases with a few boxes already placed. The one below starts as a table instead, because a step register forces the decisions a diagram lets you skip, and any diagramming tool can draw from it later.
This guide explains each column of the template, the four map types worth knowing, eight steps to create a process map with the people who do the work, the tools that read the same data, and the mistakes that leave a tidy chart nobody can use.
Download the blank process mapping template (CSV). It has one row per step with the columns ID, Role, Action or decision, Condition, Next step, Record and Uncertainty, and opens in Excel or Google Sheets.
What Is a Process Map?
A process map is a diagram of a single process from a defined trigger to a defined outcome, showing the activities, the decisions that branch the path, and the people or systems responsible for each part. The US Agency for Healthcare Research and Quality lists "process map", "cross-functional flowchart" and "swim lane flowchart" as names for the same family of diagrams, and recommends them for showing steps, examining handoffs and locating the source of a problem.
Three terms get mixed up in search results:
- Flowchart: the general diagram form with boxes, diamonds and arrows.
- Process map: a flowchart applied to business work, usually with roles attached to each step.
- Workflow mapping: the same exercise viewed from the operating side, often as preparation for routing that work through software.
The map describes one unit of work, such as one request, one order or one new hire. Mixing units (one supplier and one invoice, for instance) is the first reason maps become unreadable.
The Process Mapping Template, Column by Column
Each row is one step. Fill the rows in during the mapping session and draw the diagram afterwards. For each column: what to write, and what separates a strong entry from a weak one.
ID
A short, stable label for the row, such as S1, S2, S3. IDs let the Next step column point to rows and survive reordering. A weak entry renumbers everything when a step is inserted, which breaks every reference; add S2a instead.
Role
The role that performs the step, written as a job function rather than a person's name. "Accounts payable clerk" stays accurate after a staff change; a first name does not. A system acting alone is named as the role. A row with two roles usually hides a handoff and should become two rows.
Action or decision
Activities start with a verb and name an object: "Check purchase order reference" rather than "PO". Decisions are written as questions that can be answered from evidence available at that moment: "Required fields complete?" A weak decision ("Is it OK?") cannot be tested by anyone outside the room.
Condition
For activities, leave this blank or note when the step applies. For decisions, list each possible answer. Every answer needs its own destination in the next column, in the same order, so a reader can match "Complete; Incomplete" with the two IDs beside it.
Next step
The ID of the row that follows, or "End" with the outcome named. A decision lists one ID per answer. An empty cell on any row other than an end state is a defect in the map, not a detail to fill in later.
Record
The evidence the step leaves: a ticket status, a signed form, an entry in the ERP, an email. Free templates rarely include this column, yet it is what lets you later check the map against real transactions instead of memory.
Uncertainty
Anything the group could not agree on or did not know: "unclear who approves above the delegation limit", "some requests arrive by phone, volume unknown". Written down, a doubt cannot be quietly settled by whoever holds the marker.
Four Types of Process Map and When to Use Each
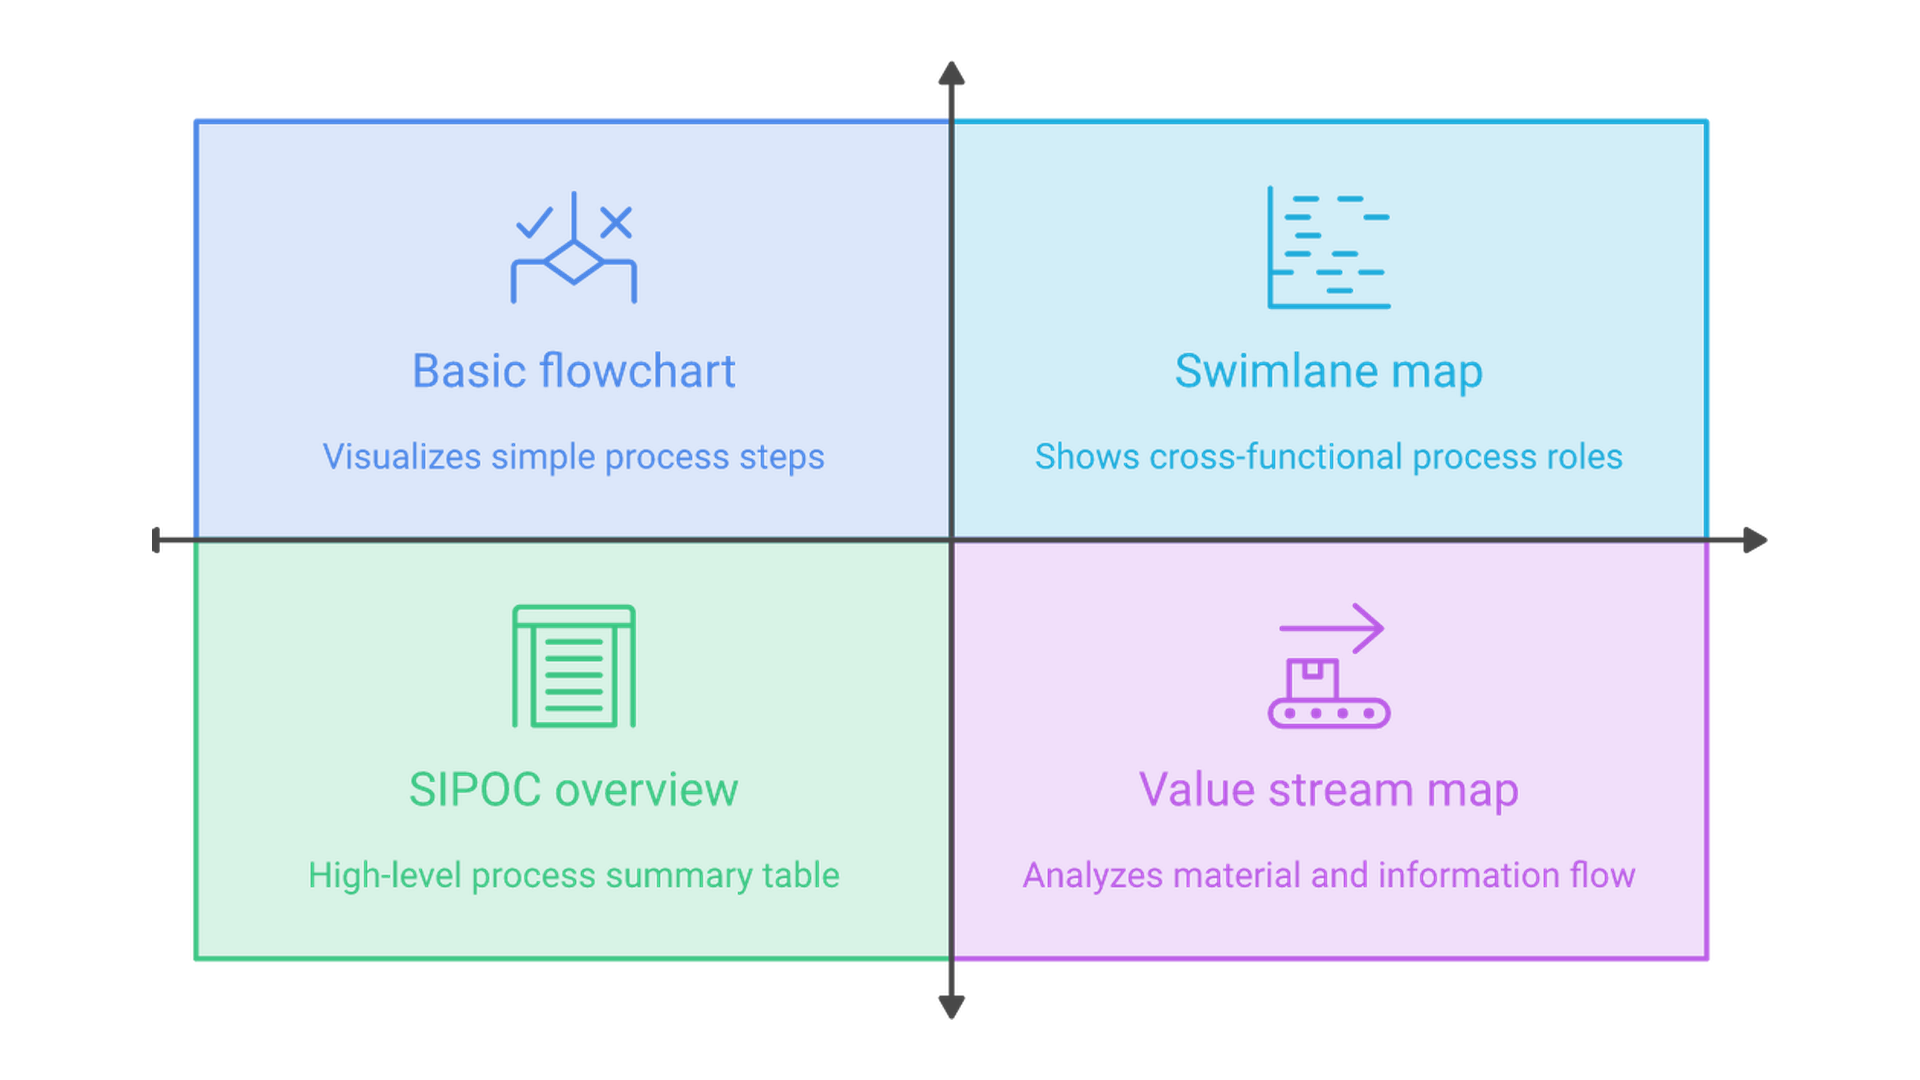
One step register can be drawn several ways. Pick the view that answers the team's question, not the most detailed one.
Basic flowchart
Sequence and decisions on a single path, with no roles shown. Use it when one team runs the process end to end, or as a first draft.
Swimlane (cross-functional) map
The same flow arranged in horizontal or vertical lanes, one per role or department. AHRQ's method places each step in the lane of the person responsible and moves later steps further along the time axis. Use it when the problem sits between teams, because every arrow that crosses a lane boundary is a handoff where work can wait or get lost.
SIPOC
A five-column table of suppliers, inputs, process, outputs and customers, with the process column limited to a handful of high-level steps. AHRQ describes it as a high-level view that helps define project scope and is most useful when inputs, suppliers or end users are unclear. Use it before detailed mapping to agree where the process starts and stops.
Value stream map
The Lean Enterprise Institute defines value-stream mapping as diagramming every step in the material and information flows needed to bring a product from order to delivery, first as a current state and then as a target future state. Use it when the question is flow speed across a whole product or service line rather than the logic of one workflow.
Symbols: keep to a small, standard set
Two standards anchor process-map notation. ISO 5807:1985 defines symbols and conventions for data, program and system flowcharts. For business processes, the Object Management Group's Business Process Model and Notation (BPMN) 2.0.2 specification is meant to be used directly by the people who design, manage and run processes, and ISO adopted it as ISO/IEC 19510. Most business maps need four shapes: rounded start/end, rectangle for an activity, diamond for a decision, labeled arrow. Full BPMN pays off when the model will feed a process engine.
How to Create a Process Map in Eight Steps
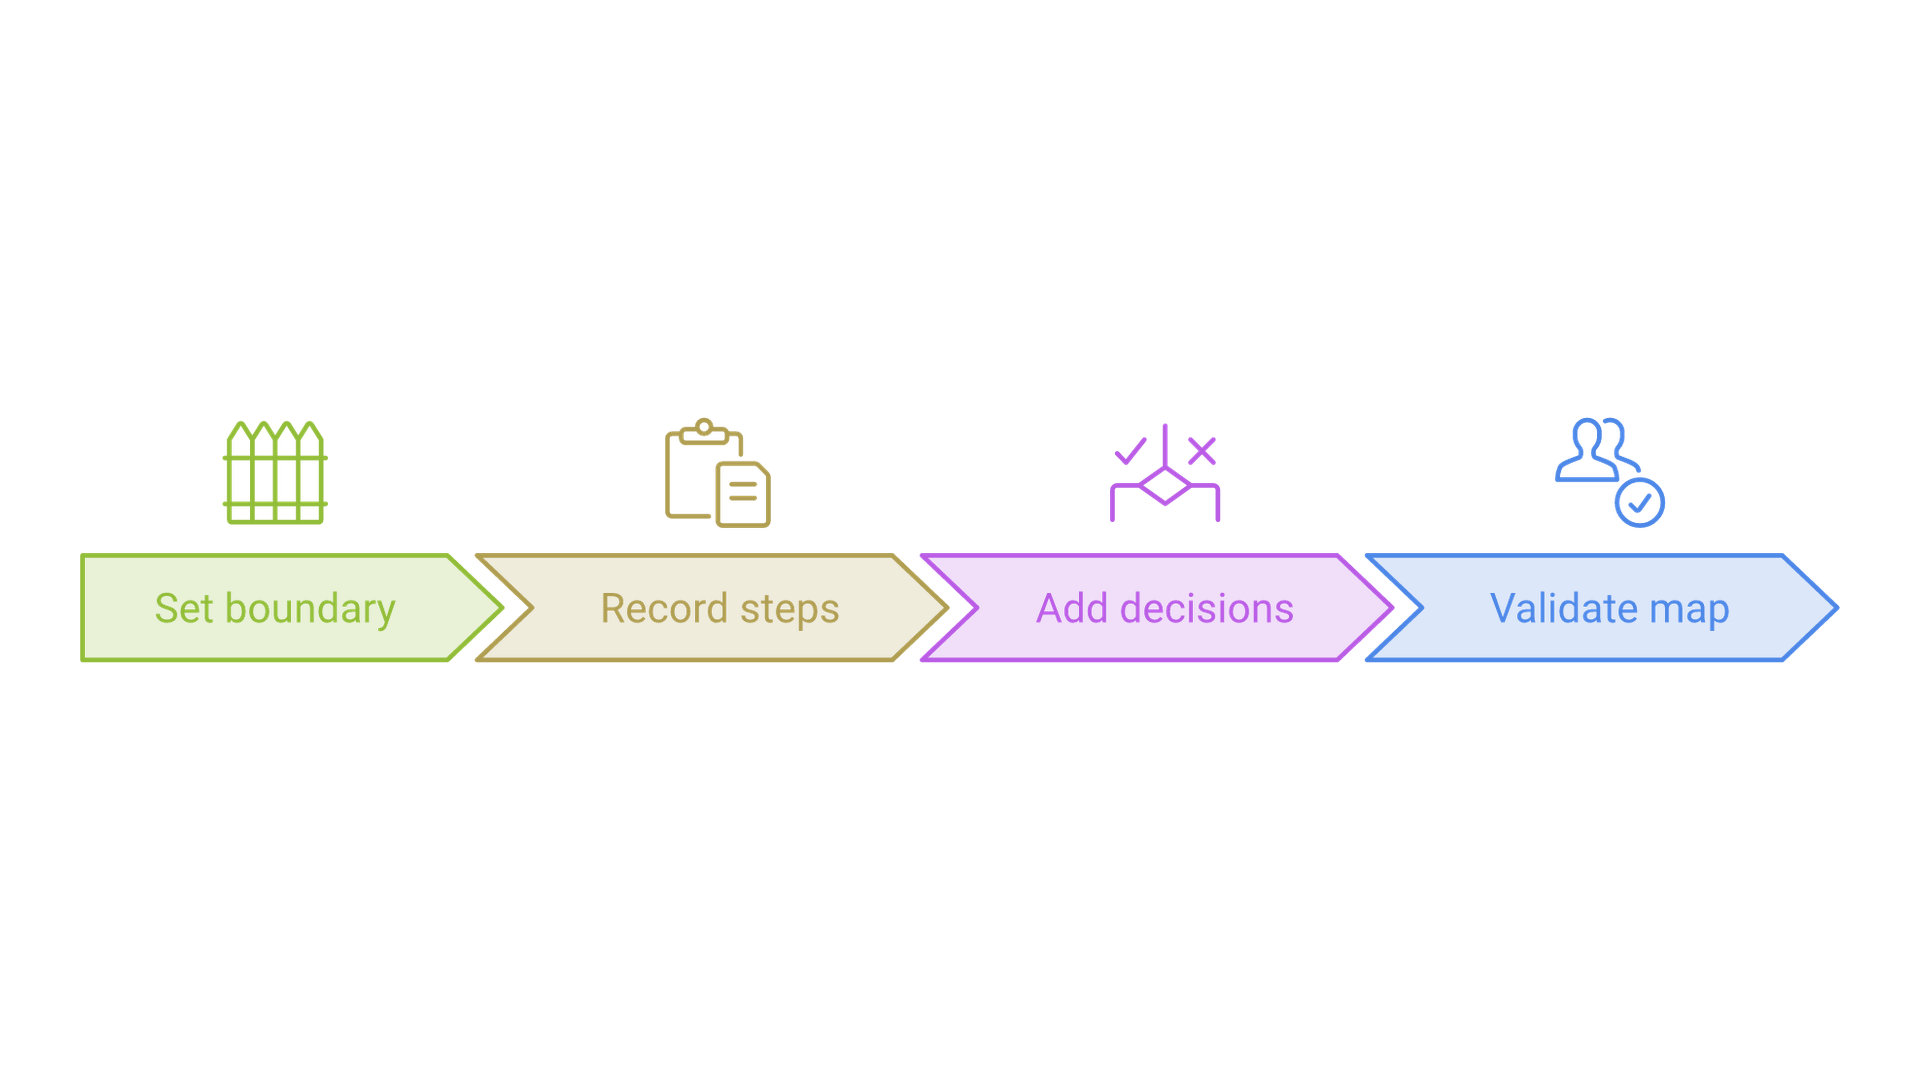
The order follows the template's columns. Run it as a working session with the people who perform the work, not only their managers.
1. Set the boundary
Name the process, the unit of work and what is excluded. "From request received to access granted, for one new employee; payroll setup is out of scope" is a boundary. "Onboarding" is a topic.
2. Fix the trigger and the outcomes
Write the event that starts the process and every way it can end: completed, rejected, withdrawn, expired.
3. List the roles
Collect every role that touches the unit of work, including systems and outside parties; they become the lanes of a swimlane map.
4. Record the steps of a recent, ordinary case
Ask the group to walk through one real item that went through without trouble, and log each action as a row.
5. Add the decisions
Wherever the path splits, insert a decision row phrased as a question, with a next step for every answer.
6. Map the exceptions and rework loops
Now walk an item that went wrong: incomplete on arrival, rejected, stuck waiting for someone. Each one adds rows or a loop back to an earlier step. A correction loop is still part of the process; leaving it off makes the map describe a process that never runs.
7. Mark handoffs and records
Fill the Record column for every row and flag each point where the Role changes. Handoffs without a record are where items disappear.
8. Validate with the people who do the work
Test the finished map by tracing at least three items through it: one normal, one that needed correction and one that stalled. Every branch should reach an end state, every row should have an owner, and every end state should leave a record. AHRQ's flowchart method ends the same way, with a review by the people who actually carry out the process. Then ask someone who was not in the session to follow the map alone; where they get lost, the map is ambiguous.
If your team wants an outside facilitator to run these sessions and turn the current-state map into a redesign, see our process improvement consulting work.
Process Mapping Examples: The Shapes to Expect
Common business processes have recognizable structures, and knowing the shape in advance tells you which decisions and loops to ask about. Your own map should still come from your own walkthroughs.
- Purchase-to-pay: request, approval against a spending limit, purchase order, goods or service receipt, invoice match against order and receipt, payment. The mismatch branch at matching is the loop to capture.
- Employee onboarding: signed offer, parallel tasks across HR, IT and the hiring manager (accounts, equipment, training plan), then a first-day readiness check. A fan-out and merge, which suits a swimlane view.
- Customer support escalation: ticket received, first-line diagnosis, a decision on whether it can be resolved at that level, escalation to a specialist tier, resolution and confirmation with the customer. Check the return path for fixes that did not work.
- Order-to-cash: order entry, credit check decision, fulfillment, invoicing, payment receipt and cash application. Exceptions cluster at credit holds and unmatched payments.
A documented case from our own work shows why the exception paths matter. For an advisory firm whose cost-modeling methodology could only be run by one senior partner, Cognativ held whiteboard sessions with that partner to map the full process, including the formulas, decision trees, exception paths and review points that made the method valuable. That map became the specification for an automation tool, and the published case study reports that engagement delivery became 50% faster.
Process Mapping Tools: From Spreadsheet to BPMN Modeler
Because the template is a table, it moves between tools with little rework. None of these is required.
- Excel or Google Sheets: the natural home for the step register; filtering on Uncertainty produces the follow-up list.
- Microsoft Visio: its Data Visualizer templates draw a flowchart from an Excel table with columns named Process Step ID, Process Step Description, Next Step ID, Connector Label, Shape Type and Function/Phase. Our ID, Action, Next step, Condition and Role columns map onto those directly. Microsoft documents that the Data Visualizer templates require Visio Plan 2.
- draw.io: its CSV import (Arrange, Insert, Advanced, CSV) builds a diagram from rows plus a few formatting lines, so the register can become a diagram without manual drawing.
- Lucidchart and Miro: shared canvases with swimlane shape libraries, suited to remote workshops.
- Mermaid: a text syntax for flowcharts with decision nodes, labeled arrows and subgraphs that can act as lanes.
- BPMN modelers: tools built on the OMG standard, appropriate when the model will be executed by a workflow or process engine rather than read by people.
Process Mapping Mistakes to Avoid
- Mapping the policy instead of the practice. A map drawn from the procedure manual shows how work should move. Check it against the records it claims to leave.
- Combining current and future state. Draw the target design as a separate version with its own date.
- Unlabeled diamonds. Unlabeled branches force readers to guess the condition and can hide a missing path.
- Keystroke-level detail in the main flow. Push screen-by-screen instructions into a linked sub-process or a work instruction, and keep the main map at the level of meaningful handoffs.
- No owner and no date. Without a named owner and review date, a map drifts from reality unnoticed.
- Treating silence as approval. A request waiting on an approver who never answers is an open item with an escalation path, not a completed step.
From Process Map to Improvement or Automation
A validated map tells you where to look; it does not tell you which step is slowest or costliest. Use the Record column to pull timestamps for the steps you suspect, and measure waiting time separately from working time before you redesign anything.
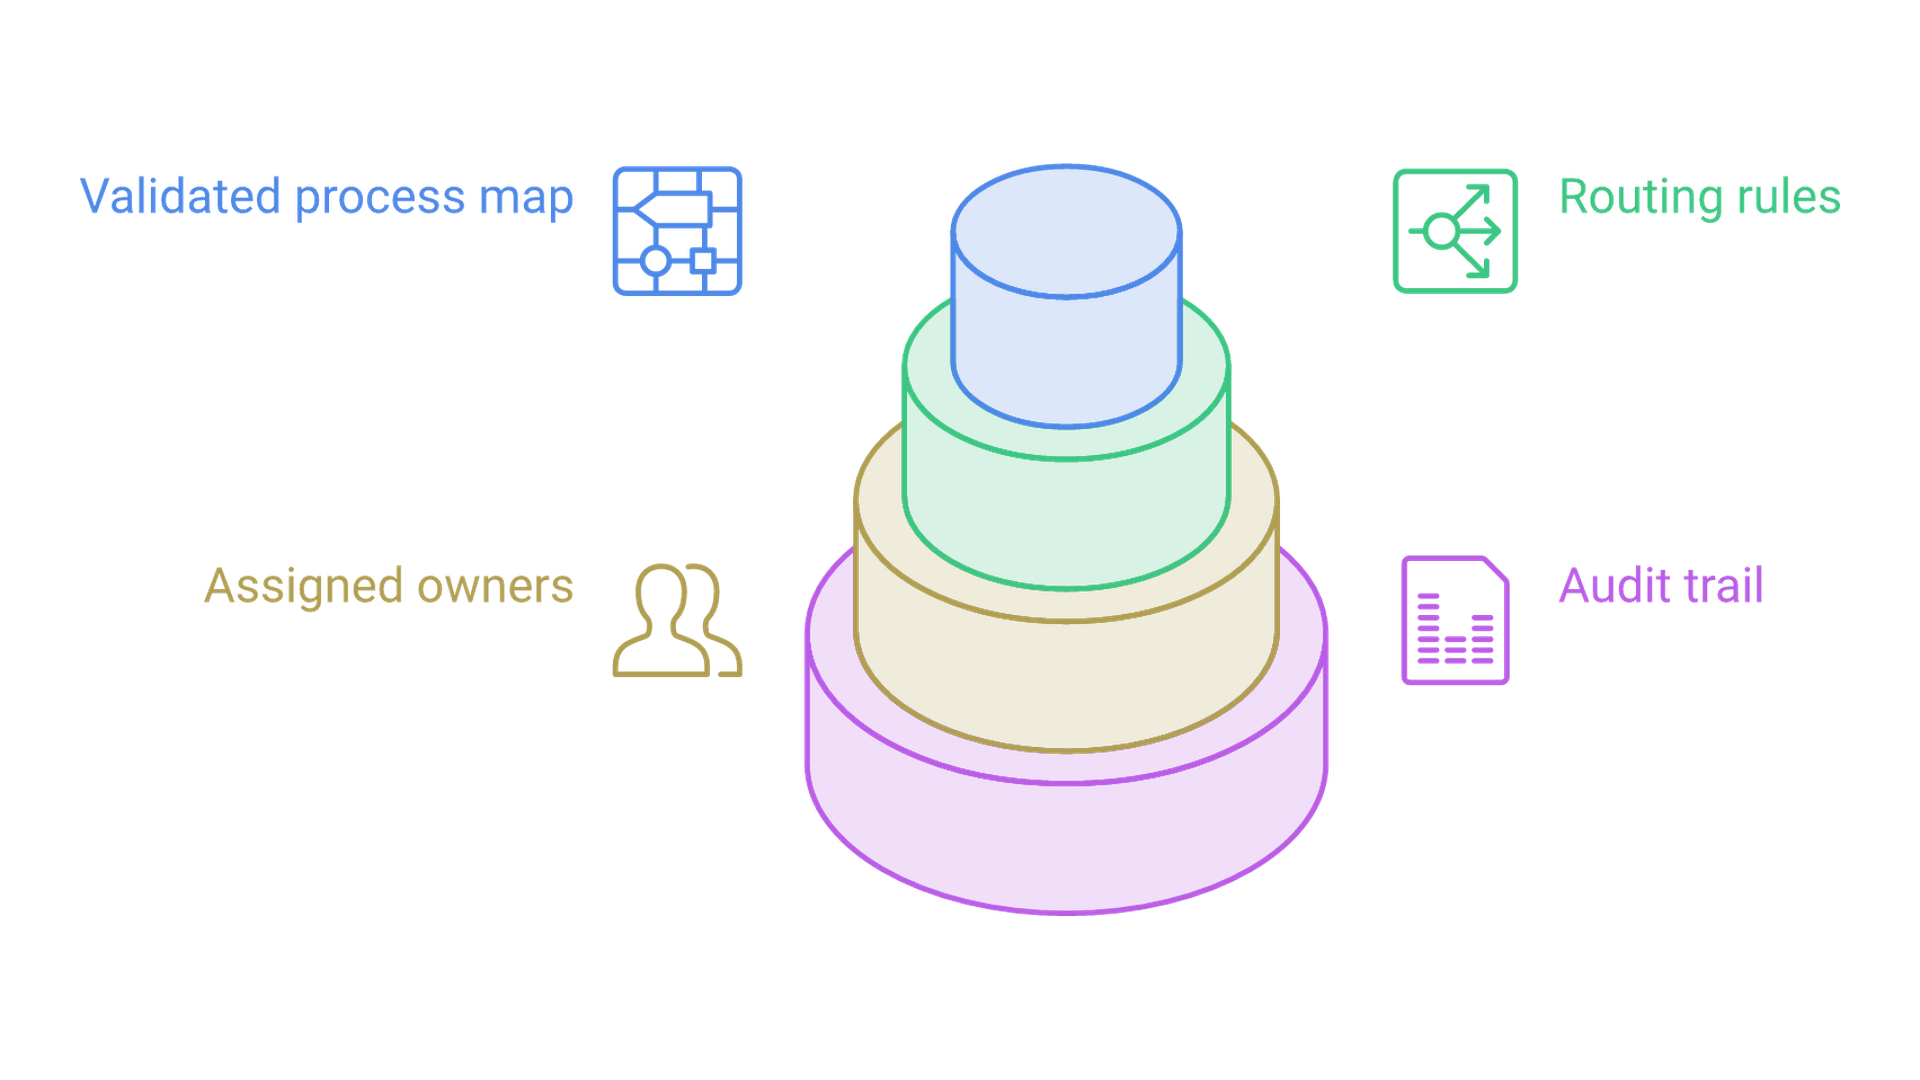
Automation comes after the decisions and exceptions are settled. Routing an unclear process through software makes the same confusion run faster, and every unowned exception becomes a stuck item in a queue. Once each decision row has a testable condition and every exception has an owner, the step register is close to a requirements list for workflow automation: the conditions become routing rules, the roles become assignees and the records become the audit trail.
Frequently Asked Questions
What should a process map template include?
A step ID, the responsible role, the action or decision, branch conditions, the next step, the record each step leaves and open uncertainties, under a boundary statement naming the trigger and end states.
How do you create a process map?
Set the boundary, trigger and end states, list the roles, record an ordinary case, then add decisions, exceptions and records, and validate by tracing real items with the people who do the work.
What are the four types of process maps?
The four most widely used are the basic flowchart, the swimlane or cross-functional map, the SIPOC diagram and the value stream map.
Can you make a process map in Excel?
Yes. Excel works well as a step register, and its shapes can draw a simple flowchart. Microsoft's Visio Data Visualizer can also generate a flowchart from an Excel table, although Microsoft lists Visio Plan 2 as a requirement.
What is the difference between a process map and a flowchart?
A flowchart is the general diagram form. A process map is a flowchart of business work that usually shows who performs each step, which is why swimlane maps are the most common process-map format.
What symbols are used in process mapping?
A rounded shape for start and end, a rectangle for an activity, a diamond for a decision and arrows for flow cover most business maps. ISO 5807 and BPMN 2.0 define fuller symbol sets for documents, data and events.
Conclusion: Start with the Table, Then Draw
A process map is useful when a stranger can trace any item through it and reach a recorded outcome. The blank template gets you there by asking for the role, condition, next step and record of every row before anyone argues about box placement. Test it with real items, and keep the doubts in their own column until someone resolves them.
If you would like help mapping a process with your team and deciding what to fix or automate first, contact Cognativ to talk it through.