

Value Stream Mapping: Steps, Symbols, Examples and Current vs. Future State Maps
Learn to draw a value stream map that exposes waiting, rework and handoffs, then design a leaner future state with an owned plan for an office or software flow.
Value stream mapping is a lean method for drawing every step, handoff and wait that a piece of work passes through on its way to the customer, so that a team can see where time is lost and design a better flow. It started on the factory floor, but the same technique now maps purchase approvals, insurance claims, customer onboarding and software releases.
This guide covers the definition, the symbols, the value stream mapping steps, current and future state maps, two worked examples, common mistakes and how the practice looks in 2026.
What Is Value Stream Mapping?
A value stream is the full set of actions, both value-adding and non-value-adding, required to take one product or service from request to delivery. Value stream mapping (VSM) is the practice of drawing that stream on one page. The Lean Enterprise Institute's lexicon describes it as a diagram of every step in the material and information flows needed to bring a product from order to delivery, and traces the tool to Toyota, where it was known as material and information flow mapping.
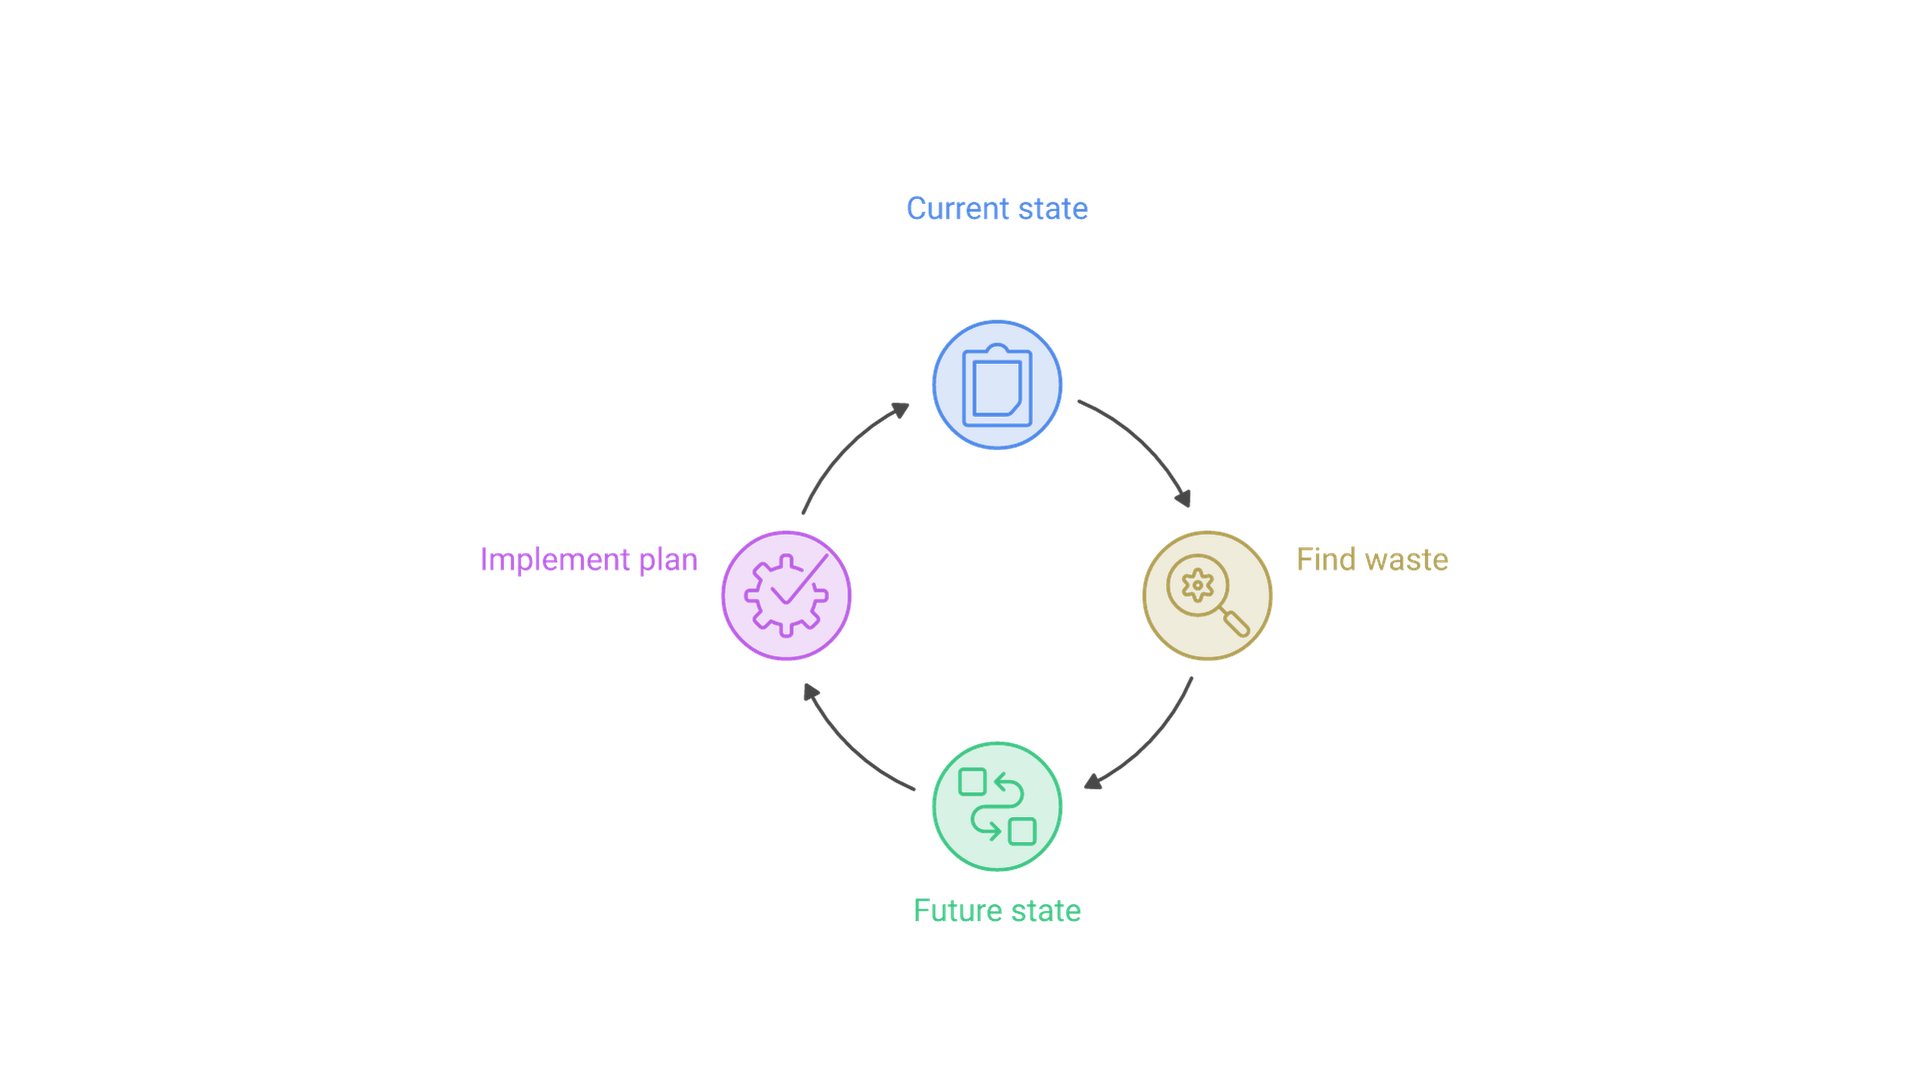
The method reached a wide audience through Learning to See, a workbook by Mike Rother and John Shook published by the Lean Enterprise Institute, which received a Shingo Research Prize in 1999. Its sequence is still the standard one: map the current state, find the waste, draw a leaner future state, and write a plan to get there.
A value stream map differs from an ordinary process map or flowchart in three ways:
- It covers the whole stream, not one department's procedure.
- It shows information flow as well as work flow, such as how tickets tell each step what to do next.
- It measures time, separating working time from waiting time.
How Value Stream Mapping Works: Work, Information and Time
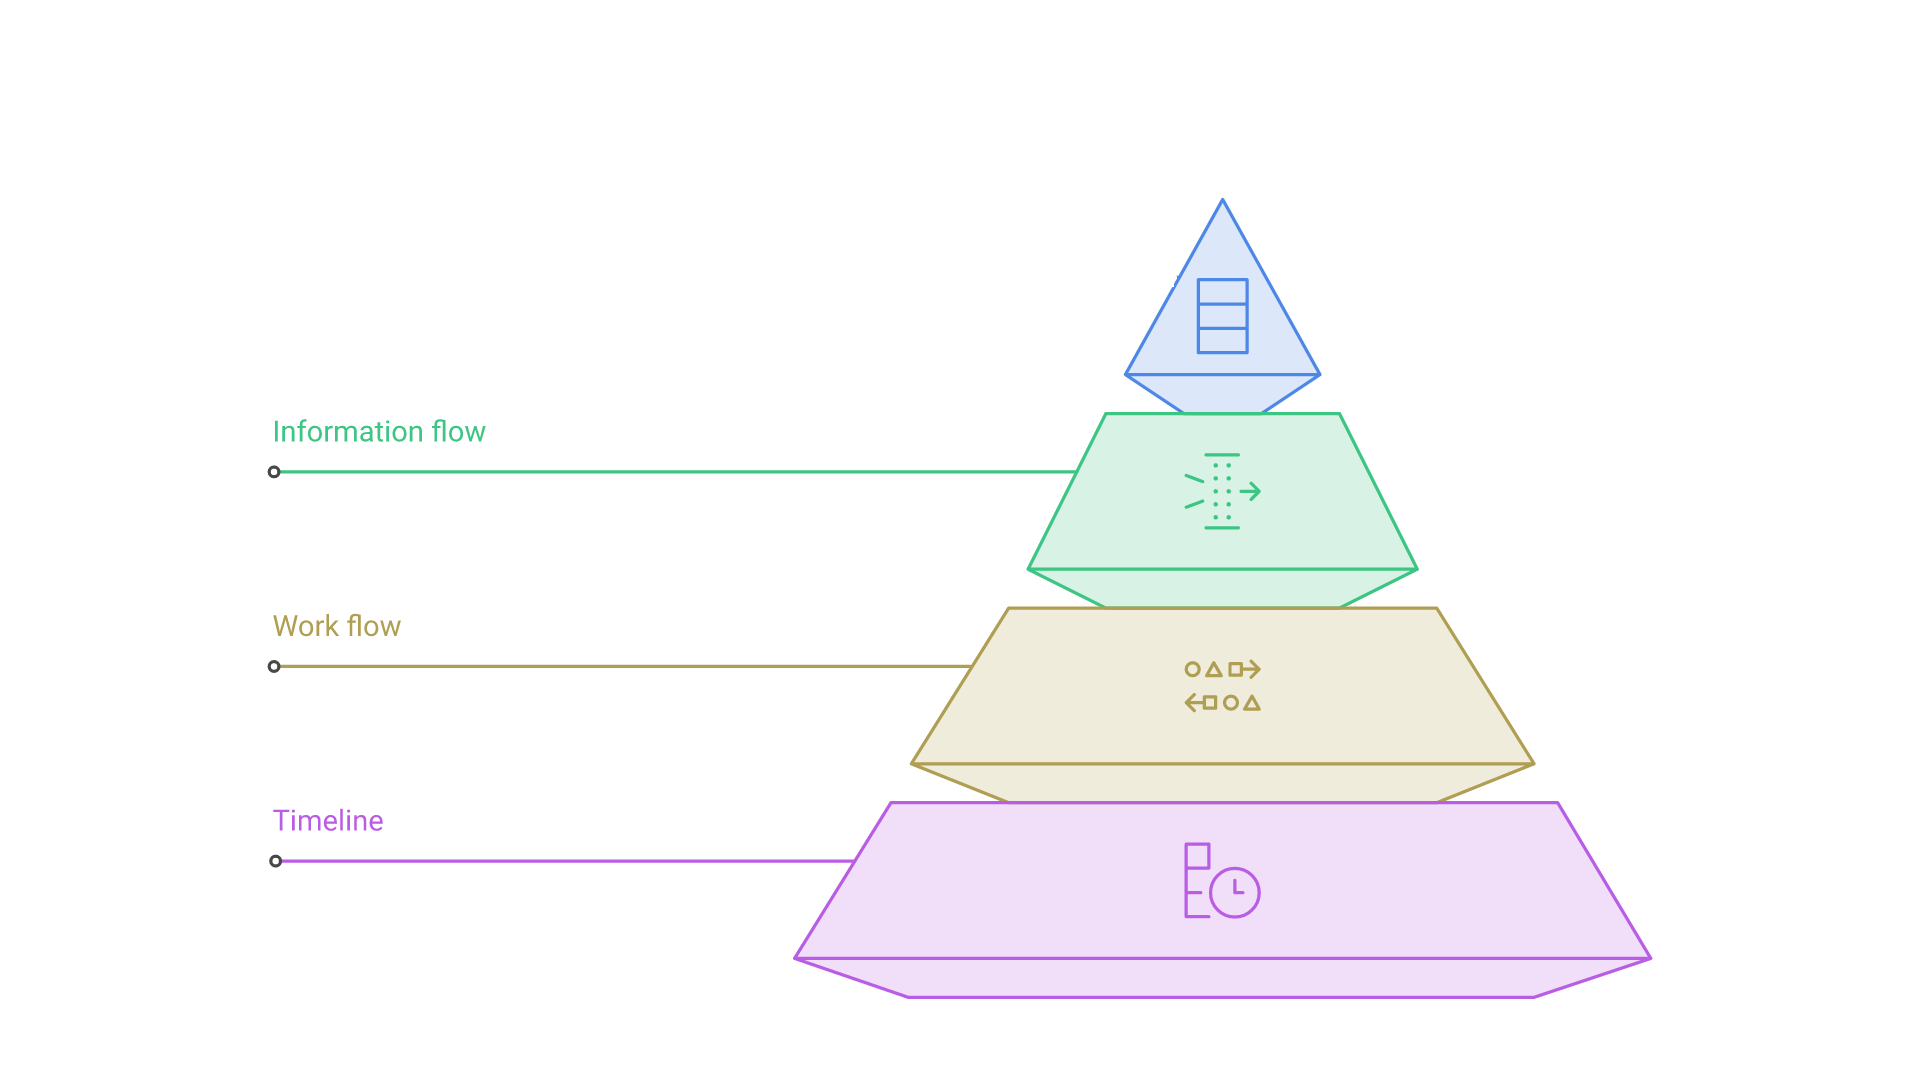
Every value stream map has three layers that are read together.
The work flow
Across the middle of the map, process boxes show each step in order, from the supplier or requester on the left to the customer on the right. Between the boxes sit queues: parts in a warehouse, invoices in an inbox, pull requests waiting for review. Arrows show whether work is pushed to the next step when it is finished or pulled when the next step is ready.
The information flow
Along the top, the map shows how each step learns what to do: a production schedule, an email, a ticket in a queue, an automated trigger. Many delays hide here, when the signal to start arrives late or in a batch.
The timeline
Along the bottom, a stepped line records two numbers for each step. Process time is the time spent working on one item when nothing interrupts. Lead time is the elapsed time from when a step receives work until it hands the work on, including waiting. Summed across the stream, the gap between total lead time and total process time is usually the key finding: items spend far more time waiting than being worked on.
A third measure, percent complete and accurate (%C&A), records how often a step receives work from upstream that it can use without correction or chasing missing information. Low %C&A marks rework loops that the timeline alone does not show.
Value Stream Mapping Symbols
Value stream mapping symbols come from lean manufacturing, and most diagramming tools ship a standard set. Office and software teams often simplify them, which is fine if everyone understands the notation.
| Symbol | What it represents | Office or software equivalent |
|---|---|---|
| Customer or supplier (factory icon) | The start and end of the stream, usually supplier at upper left, customer at upper right | Requester, client, end user |
| Process box | A step where work is done by one team, machine or function | Review, approval, build, test, deploy |
| Data box | Metrics for the step above it, such as cycle time, batch size or uptime | Process time, lead time, %C&A, people involved |
| Inventory triangle | Work waiting between steps, with a count beneath it | Queued tickets, unread requests, open pull requests |
| Push arrow | Work moved downstream whether or not the next step is ready | Batch handoffs, mass email assignments |
| Supermarket and kanban | A controlled stock point and the signals that let downstream steps pull work | Work-in-process limits on a board |
| Electronic information arrow | Digital information flow, such as EDI or system messages | System integrations, webhooks, notifications |
| Kaizen burst | A problem or improvement opportunity marked on the map | Same use |
| Timeline | Waiting and processing time for each step along the bottom | Same use |
Value Stream Mapping Steps: How to Create a Value Stream Map
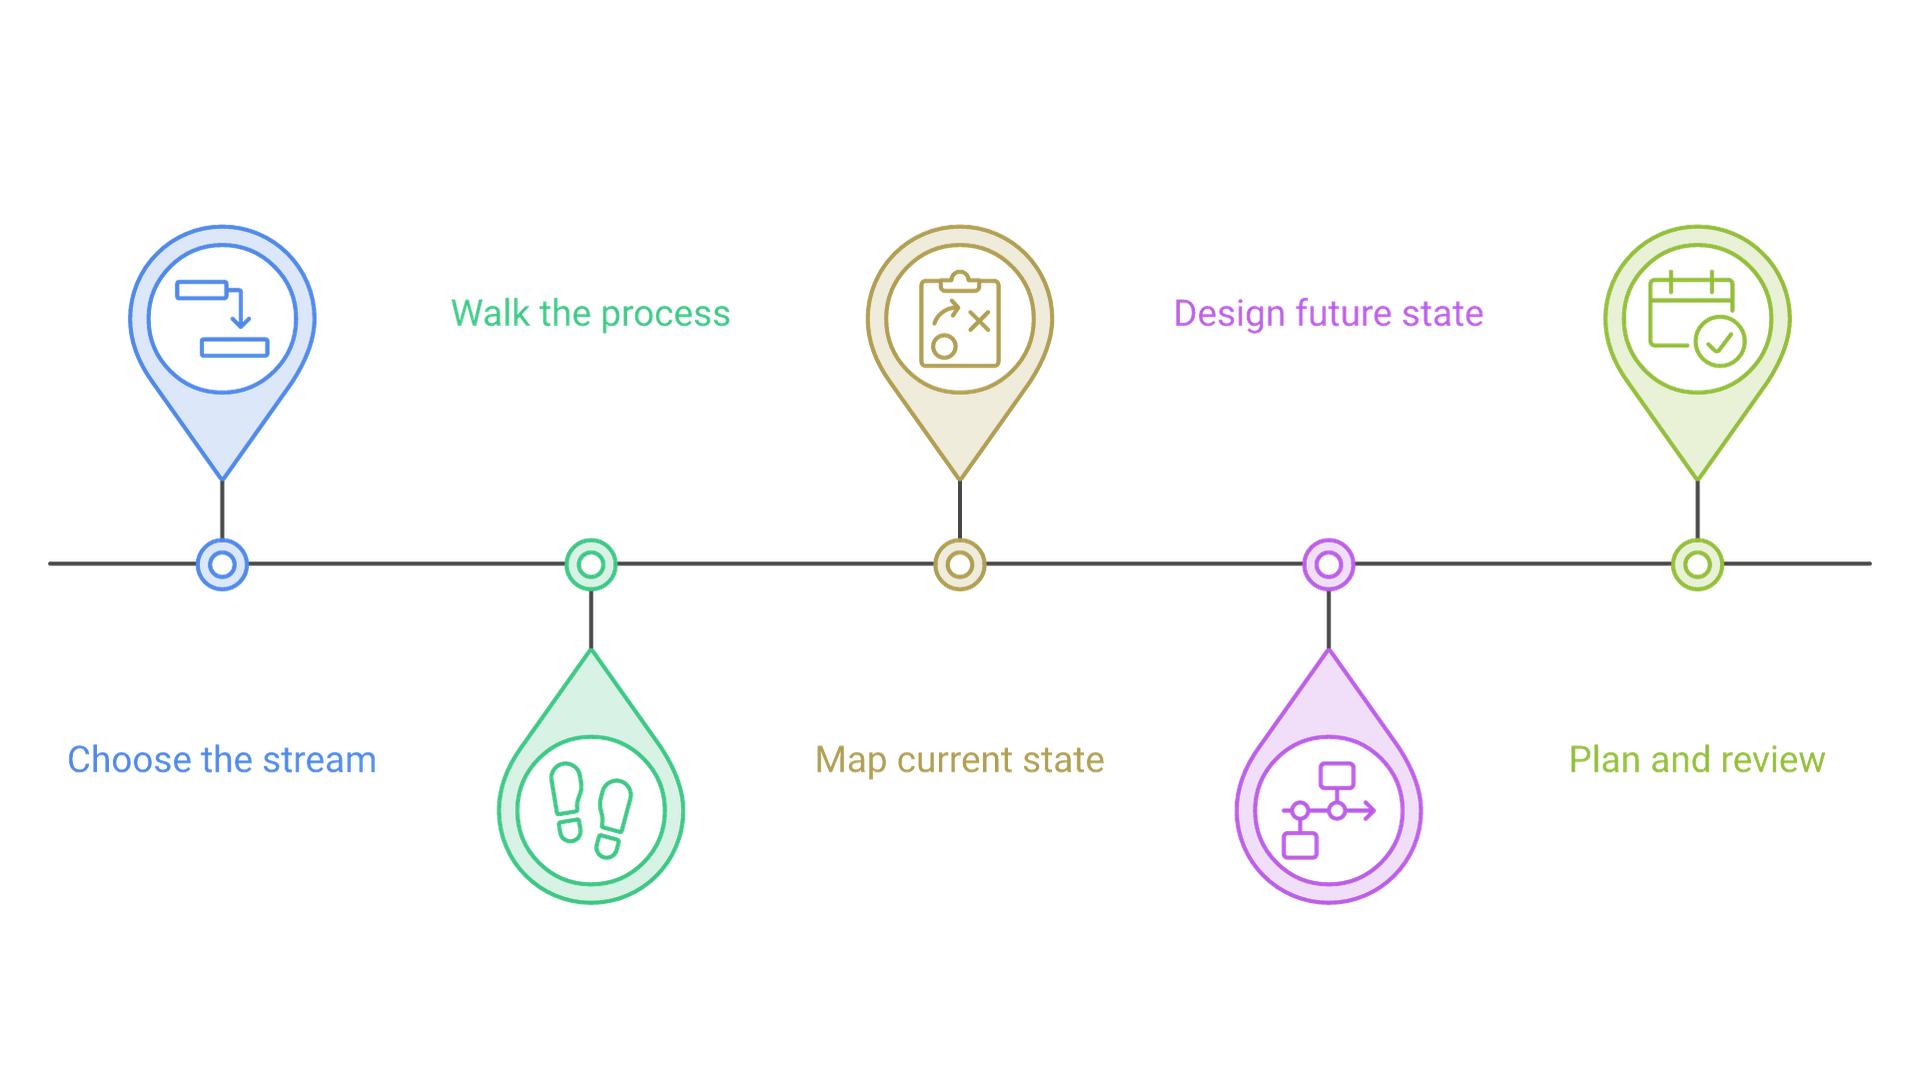
These steps follow the classic current-state, future-state, plan sequence, adapted for office and digital work as well as production.
1. Choose one value stream and one family of work
Pick a single product, service or request type that follows roughly the same path,, such as "new commercial customer onboarding" rather than "sales operations."
2. Set the scope and the sponsor
Define where the stream starts and ends, and name a sponsor who owns the whole flow and can change cross-team rules.
3. Assemble the people who do the work
Invite one person from every step, plus the people who receive the output. They know the workarounds no procedure records.
4. Walk the process and collect real data
Follow actual items through the stream and record what happens, not what the procedure says. Ticket timestamps and approval histories are the office equivalent of a stopwatch.
5. Draw the current state map
Sketch the steps, queues, information flows and timeline, typically in five to fifteen process blocks.
6. Analyze the waste
Mark kaizen bursts where lead time far exceeds process time, where %C&A is low, where work is batched or pushed, and where information arrives late. Look first at the constraint, because improving a step that is not the bottleneck rarely shortens total lead time.
7. Design the future state map
Redraw the stream as it should work: fewer handoffs, smaller batches, pull signals, steps combined or removed, and quality built in upstream.
8. Write the implementation plan and review it
Break the future state into owned, dated actions, then review progress regularly and remap once the changes stick. If your team needs a facilitator to run this cycle across departments, Cognativ's process improvement consulting covers mapping, analysis and the follow-through plan.
Current State and Future State Value Stream Maps
The current state value stream map and the future state value stream map are two halves of one exercise, and the order matters. The current state map records how the stream actually runs today, with real numbers. Skipping it usually reproduces assumptions rather than fixing them.
The future state map is not a cleaned-up copy of the current state. It is a target condition, typically set six months to two years out, built by answering a few questions:
- What does the customer actually need, and at what pace?
- Where can work flow continuously from one step to the next instead of waiting in a queue?
- Where must queues remain, and how will downstream steps pull work instead of receiving pushed batches?
- Which steps can be removed, combined or automated?
Once the future state is reached, it becomes the new current state, and the cycle starts again.
Value Stream Map Examples: An Office Workflow and a Software Release
The two examples below are illustrative composites, not client data.
Example 1: purchase order approval
A mid-size company maps the stream from an employee's purchase request to a confirmed order with the supplier. The current state has six steps: request form, manager approval, budget check, procurement review, finance sign-off and order placement. Each step takes a few minutes of real work, but the team finds that requests wait one to three days at each approval, and about a third come back from procurement because a quote or cost center is missing. Total process time is under an hour; total lead time is around nine working days.
The future state adds required fields and quote upload to the request form to raise %C&A, merges the budget check into manager approval with a visible budget balance, sets an approval threshold below which finance sign-off is skipped, and routes requests automatically instead of by email. Several of those changes are rules in a workflow system rather than new headcount, which is where workflow automation earns its place: it enforces the future state the team designed, rather than automating the old, wasteful path.
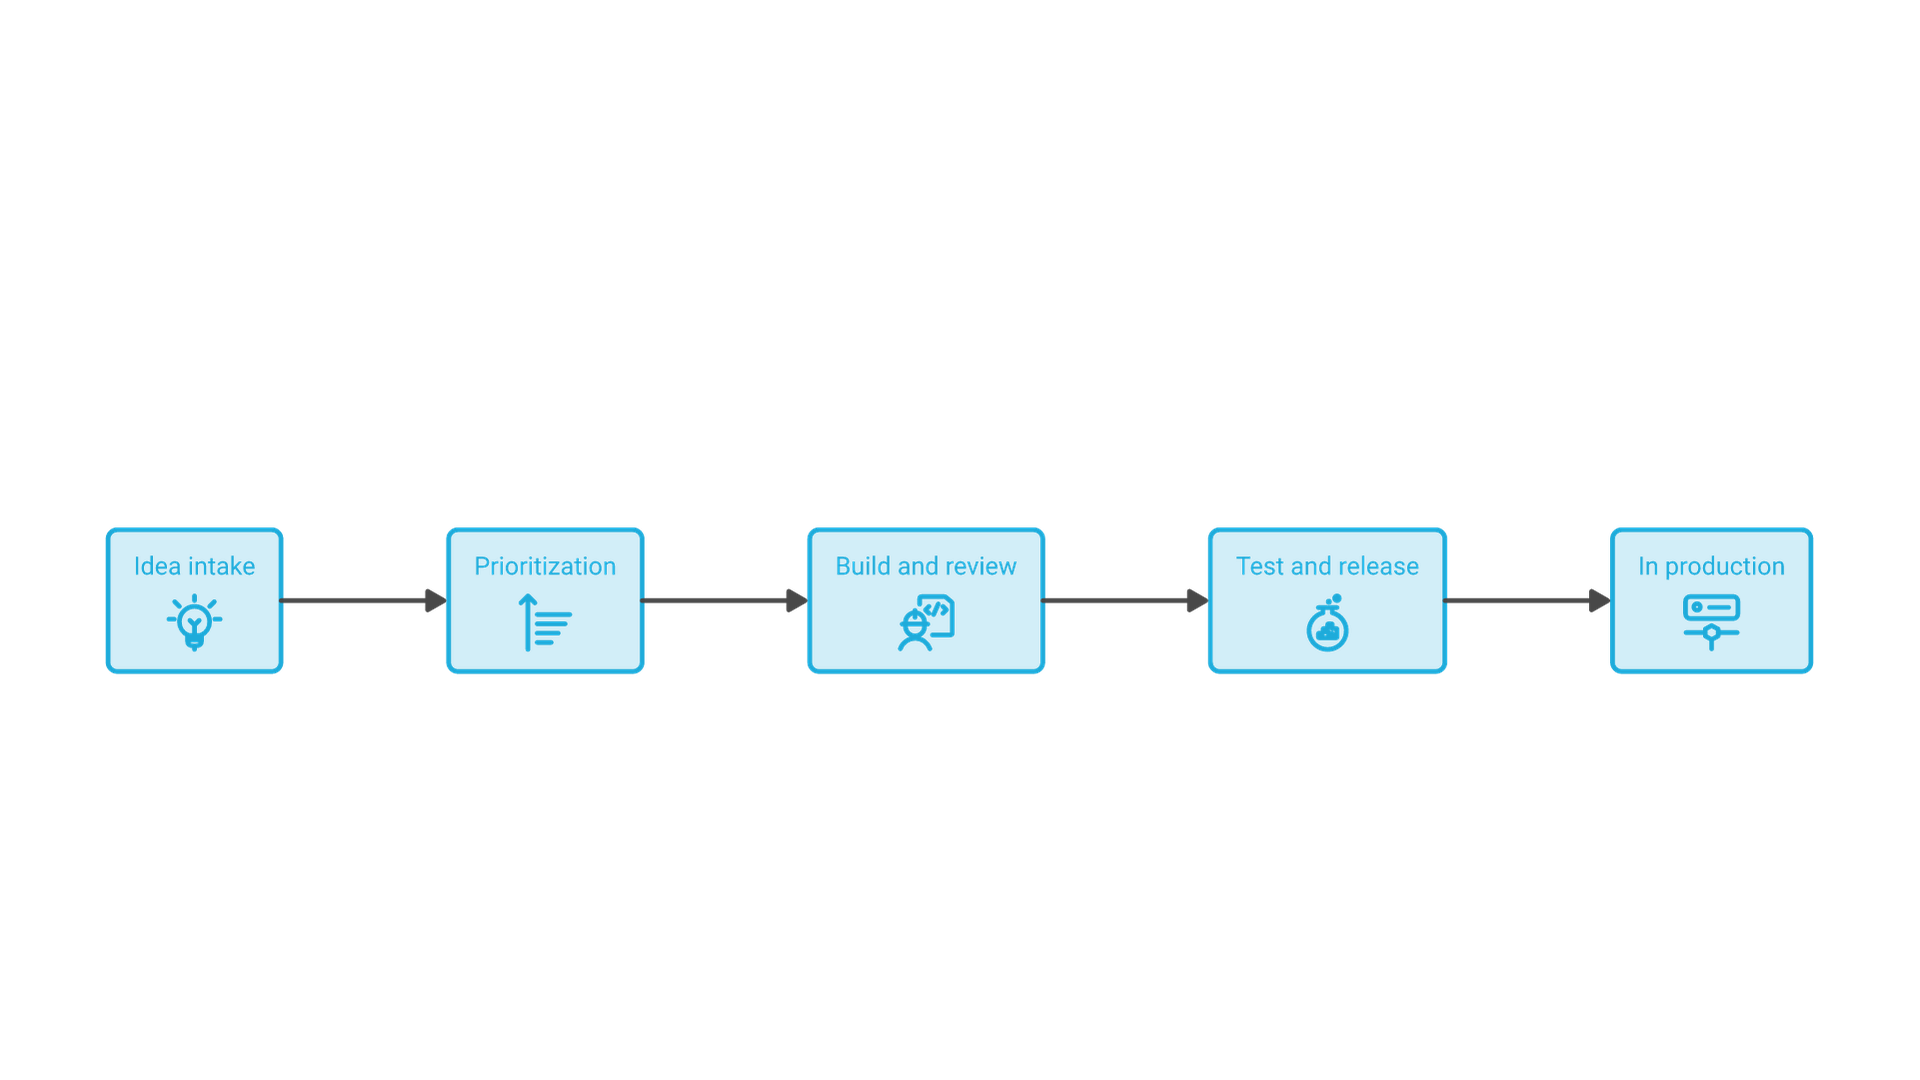
Example 2: a software change from idea to production
A product team maps one feature request from idea to running in production: intake, prioritization, design, development, code review, testing, security review, release approval and deployment. Development and testing take a few days of effort, yet the request spends weeks waiting for prioritization, for review and for a fixed release window.
The future state limits work in process, shortens the release window, moves automated tests and security checks into the pipeline, and lets small changes deploy without a change board. The DORA guidance on visibility of work in the value stream recommends exactly this kind of mapping with every stakeholder from idea to customer, using lead time, process time and %C&A for each block, and warns that mapping only the deployment pipeline invites local optimization.
Common Value Stream Mapping Mistakes to Avoid
Most failed mapping efforts fail for the same handful of reasons:
- Mapping the procedure instead of reality. Walk the work and use system data.
- Scoping too wide or too narrow. A single-department map hides the handoffs where most waiting occurs.
- No authority to change. If participants cannot change cross-team rules, the future state stays on the wall.
- Optimizing the wrong step. Speeding up a non-bottleneck step leaves lead time unchanged.
- Automating waste. Digitizing a step that should be removed makes a bad process faster, not better.
- Mapping once. Without regular review, gains decay.
Value Stream Mapping in 2026: Digital Maps and Live Data
The method itself has changed little since Learning to See. What has changed, as of 2026, is where the data comes from and how long a map stays accurate.
Data from systems, not just stopwatches
Office and software work leaves timestamps in ticketing systems, ERP and CRM records, source control and deployment pipelines. Teams increasingly pull lead time and queue data from those logs, and process mining tools reconstruct the paths items actually take. That data sharpens the current state but does not replace talking with the people doing the work, which is where causes are found.
AI as an assistant, not the analyst
AI tools can summarize workflow logs and draft a first map from event data. Treat that as a draft to verify; decisions about what to remove and who owns the change still belong to people.
Frequently Asked Questions
What is value stream mapping in simple terms?
Value stream mapping is a one-page drawing of every step, handoff and wait that a product or service passes through from request to delivery. It shows where work flows and where it waits, so teams can remove waste.
What are the steps of value stream mapping?
Choose one value stream, set the scope and sponsor, gather the people who do the work, walk the process and collect real data, draw the current state map, analyze the waste, design the future state map, and write and review an implementation plan.
What is the difference between a current state and a future state value stream map?
The current state map records how the process runs today, with measured times and queues. The future state map is a target design, usually six months to two years out, that removes waste, reduces handoffs and introduces flow and pull.
What symbols are used in a value stream map?
Common symbols include customer and supplier icons, process boxes, data boxes, inventory triangles, push arrows, supermarkets and kanban signals, electronic information arrows, kaizen bursts for problems, and a timeline at the bottom that records waiting and processing time.
Can value stream mapping be used outside manufacturing?
Yes. The method is widely used for office and administrative processes, healthcare, logistics and software delivery. Queued tickets replace inventory, but the logic of flow and waste is the same.
How long does a value stream mapping exercise take?
It depends on the scope. A focused stream with the right people can reach a current and future state map in a short workshop, but collecting data and delivering the plan take longer.
Conclusion: See the Whole Stream Before You Fix It
Value stream mapping works because it forces a team to look at the whole flow at once and to measure waiting as carefully as working. The steps are simple: map the current state honestly, find the waste, design a future state, and commit to a plan with owners and review dates. The discipline lies in repeating the cycle.
If you want help mapping a value stream and turning the future state into working processes and systems, contact Cognativ to plan your next step.