


Software Cost Estimation: Methods for Accurate Estimates of Software Projects
Why early software estimates are wide, which methods narrow them, and how to turn ranges, assumptions and contingency into budgets stakeholders can trust.
Software cost estimation is the practice of predicting the effort, schedule and money a software development project will need. It underpins budgets, staffing plans, vendor decisions and the conversation every sponsor eventually has with the delivery team: "What will this cost, and how sure are you?" Done well, it helps you allocate resources, avoid financial surprises and decide early whether a project is worth doing at all.
The hard part is that software is mostly invisible until it is built. Requirements evolve, technology choices shift, and teams learn as they go. That is why mature estimators treat an estimate as a probability statement rather than a single promise, and why they combine several techniques instead of trusting one.
This guide covers the methods that matter in practice: analogous estimation, parametric models such as COCOMO II, function point analysis, three-point and PERT estimation, bottom-up estimation from a work breakdown structure, and story points with Planning Poker. It then explains the cone of uncertainty, how to manage risk and contingency, and how to present estimates so that stakeholders can make good decisions with them.
Understanding Software Cost Estimation
Software cost estimation is the systematic process of predicting the effort, duration and financial cost of a software development project. Effort is usually the primary output, expressed in person-hours, person-days or person-months; schedule and cost are derived from it once you know team size, rates and constraints. Because labor dominates most software budgets, an error in the effort estimate flows straight into the cost estimate.
Project managers play a central role. They coordinate inputs from engineers, designers, testers and business analysts, monitor progress against the baseline, manage stakeholder expectations and keep risks visible. They also need to understand the project lifecycle, because different phases call for different estimation approaches: a rough analogy is fine while a business case is being drafted, but not when a fixed-scope contract is being signed. If you want a refresher on those phases, our guide to the seven phases of the software development life cycle shows where planning and estimation sit in the wider process.
A critical factor in setting a project's budget is its scope. Scope defines the boundaries of the project: the features, deliverables, quality expectations, integrations and constraints. A clear, written scope, including what is explicitly out of scope, is the single biggest lever for a more accurate estimate.
Definition and Key Elements
A complete software cost estimate covers both direct and indirect costs. The main components are:
- Labor costs for engineering, design, testing, project management and business analysis, which usually make up the largest share of the budget
- Software licenses, cloud services, third-party APIs and tooling
- Hardware and equipment, including test devices and environments
- Overhead such as office space, utilities and administrative support
- Quality assurance, security review and compliance work
- Risk contingency and, where relevant, a management reserve
Overhead expenses cover indirect costs that are easy to forget because they do not appear in a task list. Contingency covers identified risks that may or may not occur. Both should appear as explicit line items so that reviewers can see and challenge them, rather than being hidden inside inflated task estimates.
Essential inputs for any estimate are the team you expect to have (skills, seniority and availability), the environments and equipment required, and the software requirements themselves. Considering all of these lets project managers build estimates that are comprehensive and realistic.
Effort, Schedule and Cost Are Different Numbers
It helps to separate three quantities that are often blurred together. Effort is the total work required. Schedule is the calendar time needed, which depends on how many people can work in parallel and on dependencies between tasks. Cost is effort multiplied by loaded rates, plus non-labor items. Adding people does not shrink the schedule proportionally, because coordination overhead grows with team size, so an effort estimate should never be converted into a deadline by simple division.
Why Accurate Estimates Matter
Accurate cost estimates support budget management, resource allocation and stakeholder trust. An estimate that is too low leads to overruns, rushed work, cut corners and strained client relationships. An estimate that is too high can kill a worthwhile project or lose a competitive bid. Either way, the estimate shapes decisions long before any code is written.
Barry Boehm, Chris Abts and Sunita Chulani, in their survey of cost estimation approaches, list budgeting, tradeoff and risk analysis, project planning and control, and software improvement investment analysis as the main uses of estimation models (Boehm, Abts and Chulani, "Software Development Cost Estimation Approaches: A Survey"). In other words, estimates are not only about a total price: they inform which features to build, which risks to retire first and where to invest in tools or process.
Involving the whole team in estimation improves accuracy and builds buy-in, because the people doing the work understand its complexity best. Using multiple estimation techniques and refining estimates as the project progresses further improves the result.
Core Techniques for Estimating Software Development Costs
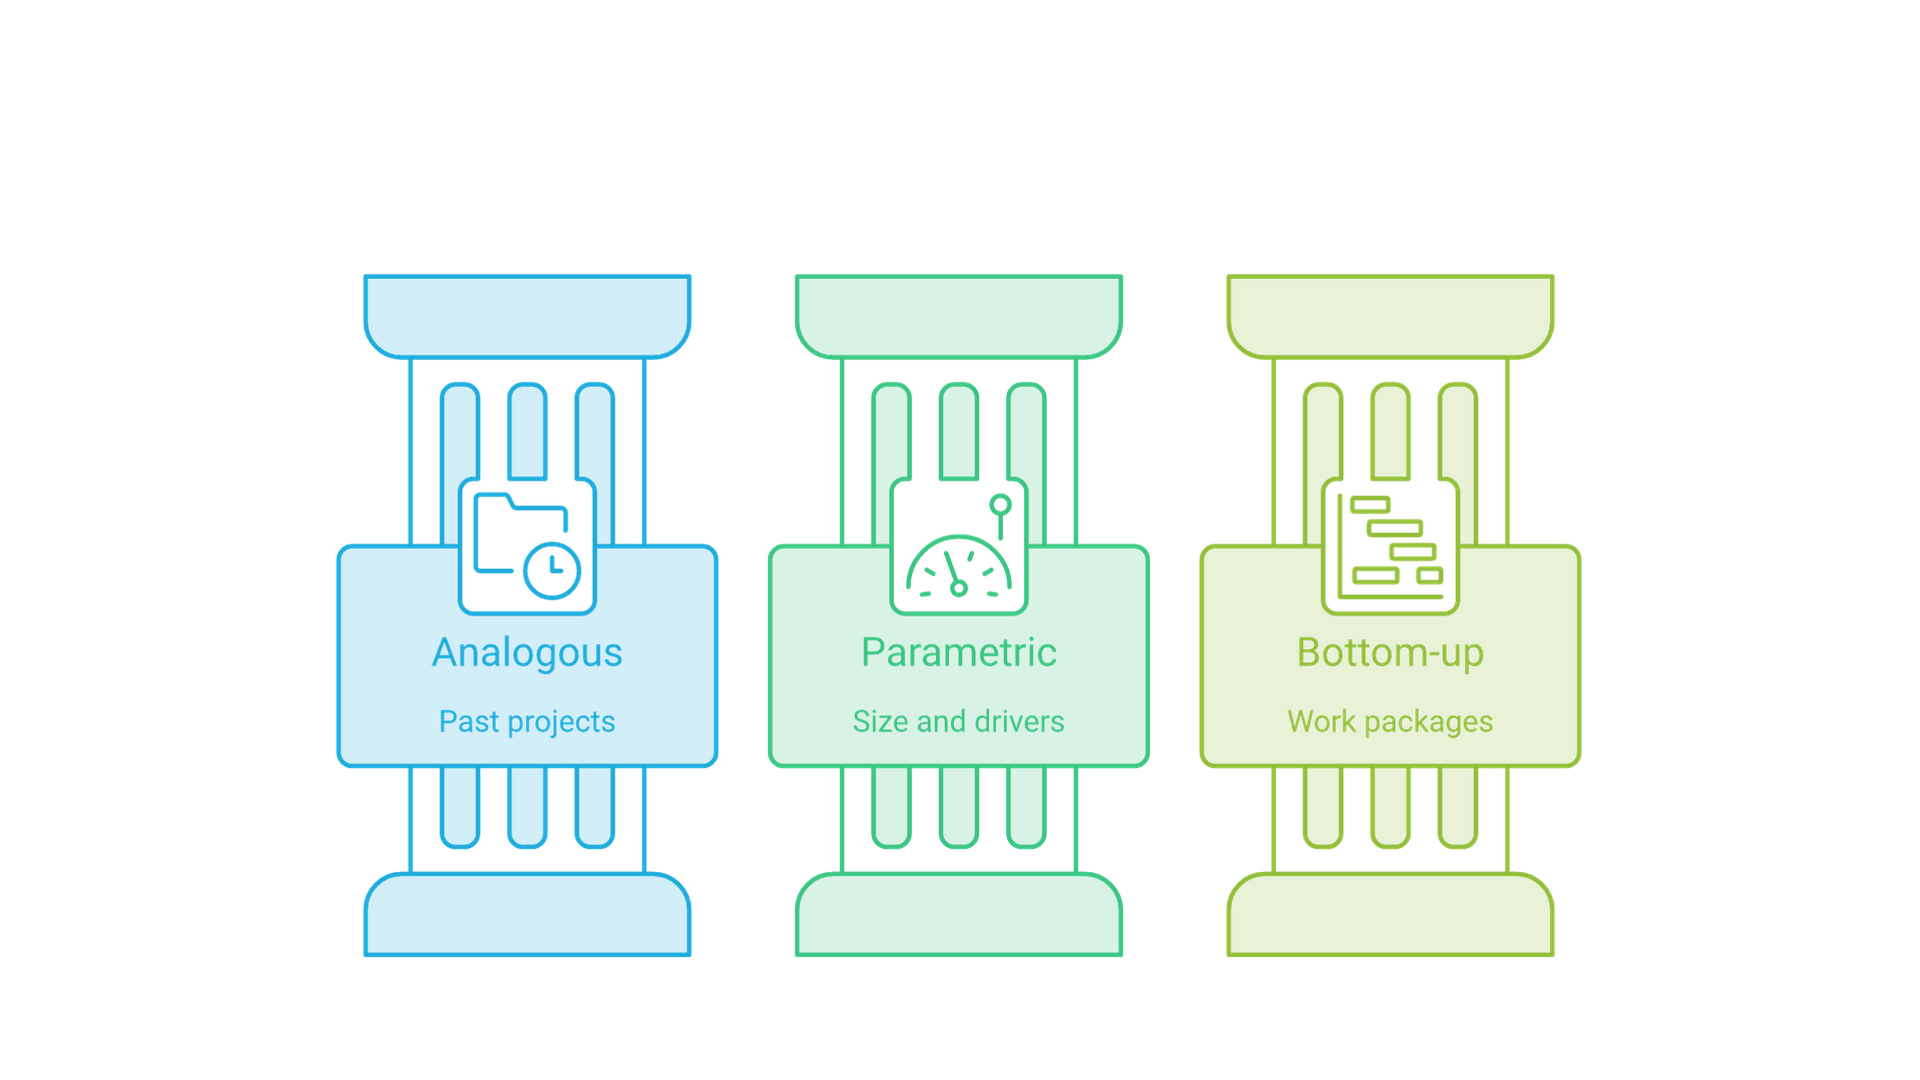
Three techniques form the backbone of most software cost estimation: analogous, parametric and bottom-up estimation. Each suits a different stage of project knowledge and a different level of detail, and selecting the right one, or the right combination, influences how reliable your budget and resource plan will be.
- Analogous estimation uses data from similar past projects to produce a quick, early estimate, with accuracy limited by how similar those projects really are.
- Parametric estimation uses statistical relationships between size, cost drivers and effort, calibrated with historical data.
- Bottom-up estimation estimates each work package individually and sums them, which is detailed and accurate but time-consuming.
Understanding these core techniques helps project managers choose a method based on the project's scope, complexity and stage, and cross-check one method against another.
Analogous Estimation
Analogous estimation, sometimes called top-down estimation or estimation by analogy, relies on data from past projects that are similar in nature. You identify one or more comparable projects, compare their size and characteristics with the new one, and adjust their actual effort or cost for the differences. Because it needs little detail, it is useful when information about the current project is limited, for example during a feasibility study or an initial budget request.
Its accuracy depends on how similar the past and current projects really are. Differences in scope, technology, team experience, integration complexity or regulatory requirements can make an analogy misleading. Boehm and colleagues note that analogy-based estimation can perform well when good comparable cases exist, and that well-documented case studies from your own organization are the most useful source.
To use analogy responsibly, document which projects you compared, what you adjusted and why. Analogous estimation remains a valuable tool for an initial budget estimate and for sanity-checking a more detailed estimate later.
Parametric Estimation
Parametric estimation uses a mathematical model that relates project characteristics to effort. The model takes a size measure, such as function points or thousands of source lines of code, plus cost drivers such as product complexity, required reliability, team capability and tool support, and predicts effort and schedule. The Constructive Cost Model (COCOMO) and its successor COCOMO II are the best-known open parametric models; commercial tools such as SEER and SLIM follow the same general approach with proprietary equations.
The strength of parametric estimation is that it is repeatable and explicit. Two estimators using the same inputs get the same answer, and stakeholders can see how changing an assumption, such as a less experienced team or a stricter reliability requirement, changes the result. Its weakness is that it is only as good as its size estimate and its calibration. A model calibrated on someone else's projects may not reflect your team, stack or delivery process.
Aligning stakeholder expectations with realistic timelines and budgets reduces conflict, and parametric models help by making the assumptions behind a number visible and open to discussion.
Bottom-up Estimation
Bottom-up estimation, also called engineering build-up, calculates costs for individual tasks and aggregates them into a total. It starts from a work breakdown structure (WBS) that decomposes the product into deliverables and work packages. In a mobile app project, for instance, UI design, backend APIs, authentication, push notifications, app store preparation and testing are each estimated separately by the people who will do the work.
Bottom-up estimates are usually the most detailed and defensible, but they take time and require a well-understood scope. They also tend to miss work that nobody listed, such as integration, deployment, documentation, project management and rework, so a good WBS includes those items explicitly. Despite the effort involved, bottom-up estimation remains the preferred method for complex projects where precise cost estimates are needed for contracts or funding approvals.
Because individual task estimates are often optimistic, many teams combine bottom-up estimation with three-point estimates for each work package, which leads naturally to the advanced methods below.
Advanced Estimation Methods
Advanced estimation techniques address the limits of single-number estimates. They make uncertainty explicit, bring structure to expert opinion and account for the cost of building quality in. Three-point estimation, expert judgment with Delphi-style methods, and cost of quality analysis are the most useful additions to the core techniques.
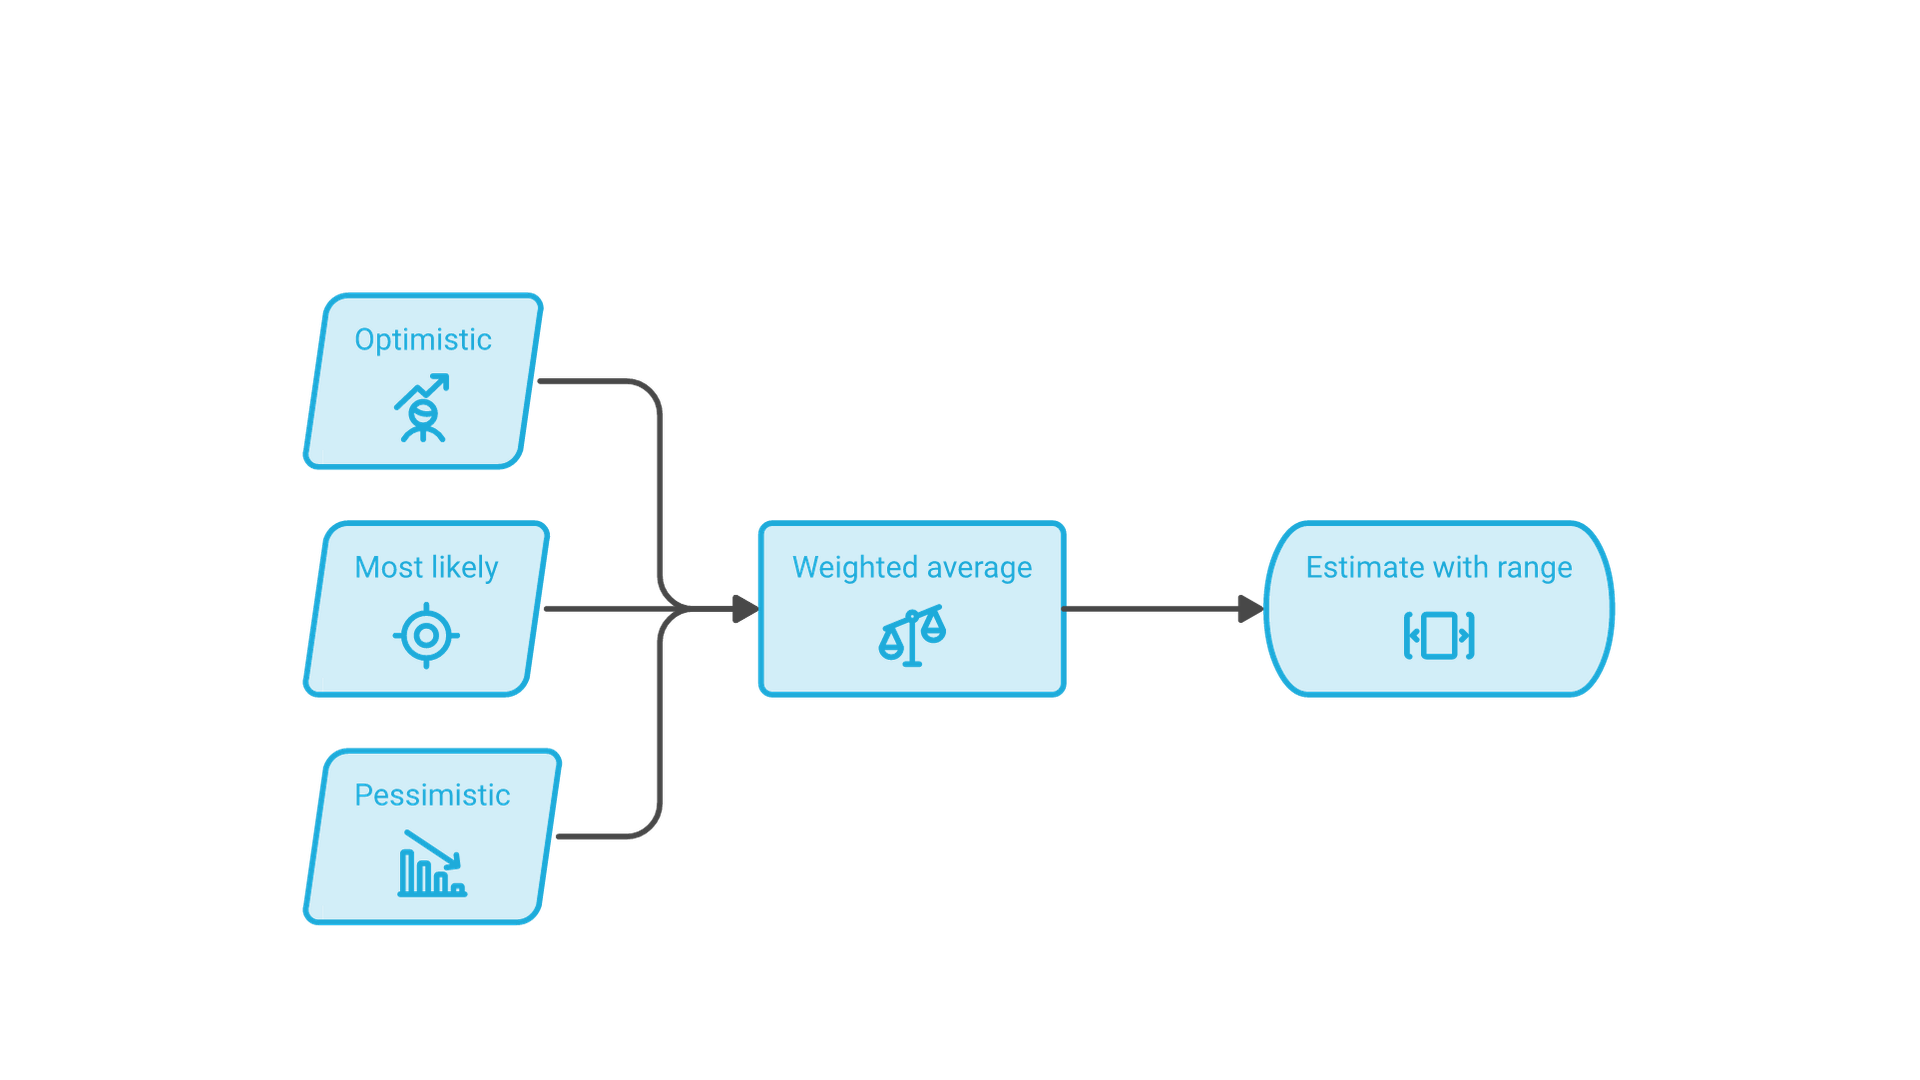
Three-point estimation accounts for uncertainty by considering optimistic, most likely and pessimistic outcomes. Expert judgment draws on the experience of seasoned professionals, especially for novel or complex work. Cost of quality analysis estimates the cost of preventing, detecting and fixing defects, so that quality work is budgeted rather than squeezed.
Three-point Estimation and PERT
Three-point estimation asks for three values for each task or work package: an optimistic estimate (O), a most likely estimate (M) and a pessimistic estimate (P). The spread between them shows how uncertain the task is, which a single number hides.
There are two common ways to combine the three values. The triangular average is (O + M + P) / 3. The PERT (Program Evaluation and Review Technique) weighted average, which approximates a beta distribution, is (O + 4M + P) / 6, and its standard deviation is commonly approximated as (P − O) / 6. The PERT formula gives the most likely value more weight while still letting a long pessimistic tail pull the estimate upward.
For a hypothetical task estimated at 5 days optimistic, 10 days most likely and 21 days pessimistic, the PERT estimate is (5 + 40 + 21) / 6 = 11 days, with a standard deviation of about 2.7 days, while the triangular average is 12 days. Both are higher than the "most likely" value, which reflects the reality that software tasks overrun more often, and by more, than they finish early.
Three-point estimates are most useful when they feed a range for the whole project rather than a single total. Summing task-level PERT means gives an expected value; combining the uncertainties, or running a Monte Carlo simulation, gives a range with a stated confidence level.
Expert Judgment and Wideband Delphi
Expert judgment uses the knowledge of experienced professionals to estimate work, particularly when the project is unusual or historical data is thin. Experts can spot hidden complexity, integration traps and staffing risks that a model will not see.
The risk is bias: one confident voice can anchor everyone else. The Delphi technique, developed at the RAND Corporation, reduces that risk by collecting independent estimates, sharing them anonymously and iterating toward consensus. Boehm's Wideband Delphi variant adds group discussion between rounds, so estimators can explain their assumptions before re-estimating. Boehm, Abts and Chulani describe Delphi and the work breakdown structure as the two main ways to capture expert judgment while limiting the chance that any one expert is badly wrong.
Cost of Quality Analysis
Cost of quality analysis estimates what it takes to prevent, detect and fix defects. Prevention includes design reviews, coding standards, automated testing and security practices. Detection includes testing and inspections. Failure costs include rework, production incidents, support and reputational damage.
The practical lesson for estimation is to budget prevention and detection explicitly. When testing, code review and security work are left implicit, they are the first to be cut under pressure, and the resulting defects reappear later as more expensive rework. Rather than assuming a fixed return on quality investment, use your own defect and rework history to decide how much to allocate.
Sizing Models and Tools for Software Cost Estimation
Most estimation errors start with a poor size estimate. Sizing methods give you a consistent measure of how much software you are building, which you can then convert into effort using historical productivity or a parametric model. The three most widely used are COCOMO II (which consumes a size estimate), Function Point Analysis and story points with Planning Poker.
Commercial estimation tools can help by packaging calibrated models, historical databases and reporting, but they do not replace good inputs. Whatever tool you use, the reliability of the output depends on the size estimate, the cost driver ratings and how well the model is calibrated to your environment. Size and effort also depend on technology choices, so it helps to settle the core components of your tech stack before committing to a detailed estimate.
COCOMO II
COCOMO II is an open parametric model for estimating software effort and schedule, developed at the University of Southern California's Center for Software Engineering under Barry Boehm. It estimates effort in person-months from a size measure, five scale factors that act on an exponent (so effort grows non-linearly with size), and a set of effort multipliers that adjust for product, platform, personnel and project characteristics.
The model has three submodels designed for different stages of knowledge. The Application Composition model targets projects rapidly assembled from interoperable components and tools such as GUI builders, and is sized in object points. The Early Design model is used when only rough architecture is known and works from function points (or lines of code) with five scale factors and seven effort multipliers. The Post-Architecture model is used once top-level design is complete and uses 17 effort multipliers (Boehm, Abts and Chulani).
Calibration matters. According to the same survey, the COCOMO II.2000 calibration over 161 projects produced estimates within 30% of actuals 75% of the time, and calibrating the constant to each major data source raised that to 80%. The authors therefore recommend that organizations calibrate the model with their own data. Treat the published defaults as a starting point, not a substitute for your own history.
Function Point Analysis
Function Point Analysis (FPA) measures software size by the functionality delivered to users rather than by lines of code. The International Function Point Users Group (IFPUG) describes function points as a logical size measure built from inputs, outputs, inquiries, internal data and external interface data, and notes that the method was developed by Allan Albrecht in the late 1970s. IFPUG's method is standardized as ISO/IEC 20926:2009, and IFPUG maintains the Function Point Counting Practices Manual (IFPUG, Function Point Analysis).
Because function points can be counted from requirements, they are available early, are independent of programming language and can be used to compare productivity across projects. IFPUG also maintains SNAP (Software Non-functional Assessment Process) for sizing non-functional requirements, which function points do not capture. The trade-off is that counting requires trained practitioners and reasonably complete requirements.
By analyzing functional requirements this way, project managers can build estimates on a measurable size and manage scope changes explicitly: when new functions are added, the count, and therefore the estimate, changes visibly.
Story Points and Planning Poker
Agile teams often size work in story points, a relative measure of the effort a backlog item requires, influenced by the amount of work, its complexity, and its risk and uncertainty. Story points are not hours; they compare items with each other, and the team's observed velocity (points completed per iteration) converts them into a schedule forecast. The Scrum Guide does not prescribe a sizing technique, but it does state that the Developers who will do the work are responsible for sizing it during Product Backlog refinement (The 2020 Scrum Guide).
Planning Poker is a collaborative technique for producing those estimates. Each estimator privately selects a card, everyone reveals at once, and the team discusses the highest and lowest estimates before estimating again. A typical deck runs 0, 1, 2, 3, 5, 8, 13, 20, 40 and 100, and some decks add cards for "I don't understand this" or "too big to estimate" (Mountain Goat Software, Planning Poker). The conversation is as valuable as the number, because it surfaces assumptions and hidden work.
Story points work well for forecasting within a stable team, but they are not comparable across teams and do not on their own produce a budget for an unstarted project. For contract-level cost estimates, teams typically pair them with analogy, function points or a parametric model, then use velocity to track and refine the forecast once work begins.
How to Choose an Estimation Method
No single technique is best in every situation. The central conclusion of Boehm, Abts and Chulani's survey is that comparing the results of several approaches is the most likely way to produce realistic estimates. The practical question is which methods to combine at each stage.
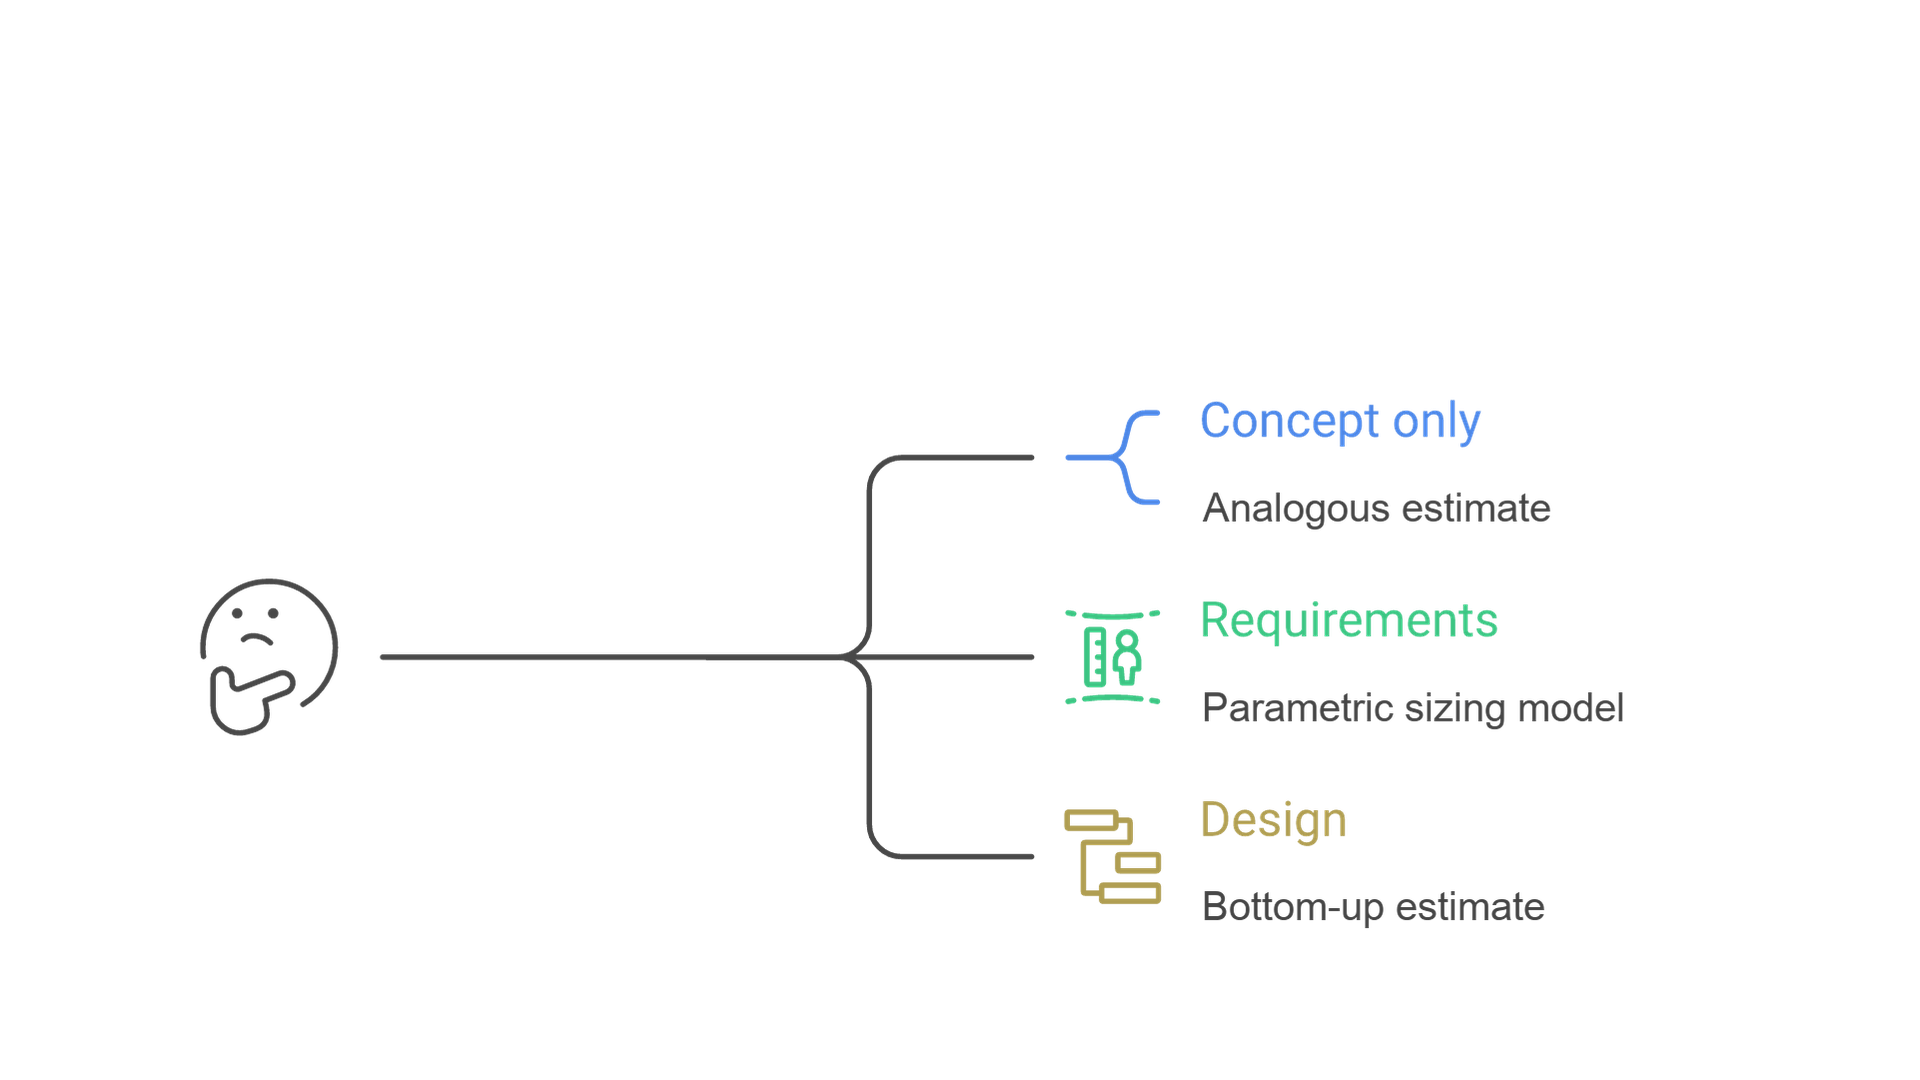
A useful rule is to match the method to what you know. When you have only a concept and a few comparable projects, use analogy and express the result as a wide range. When you have a requirements baseline, add function points and a parametric model. When you have a design and a work breakdown structure, build bottom-up estimates with three-point values for each work package. Once an agile team is delivering, use story points and velocity to forecast the remaining backlog and compare the forecast with the original budget.
Matching Methods to Project Stage
- Idea or business case: analogous estimation, expert judgment, a wide range
- Defined requirements: function points, COCOMO II or another calibrated model
- Design and work breakdown: bottom-up estimation with three-point values
- Active delivery: story points, velocity and actuals to re-forecast
Cross-checking Estimates
When two independent methods disagree significantly, treat the gap as information. It usually points to a scope assumption that one estimator made and the other did not, a misjudged complexity area or a productivity assumption that does not match your history. Resolve the gap by examining assumptions, not by averaging the numbers. If the technical direction itself is unsettled, an independent technology strategy review can narrow the options before you spend time on detailed estimates.
The Cone of Uncertainty
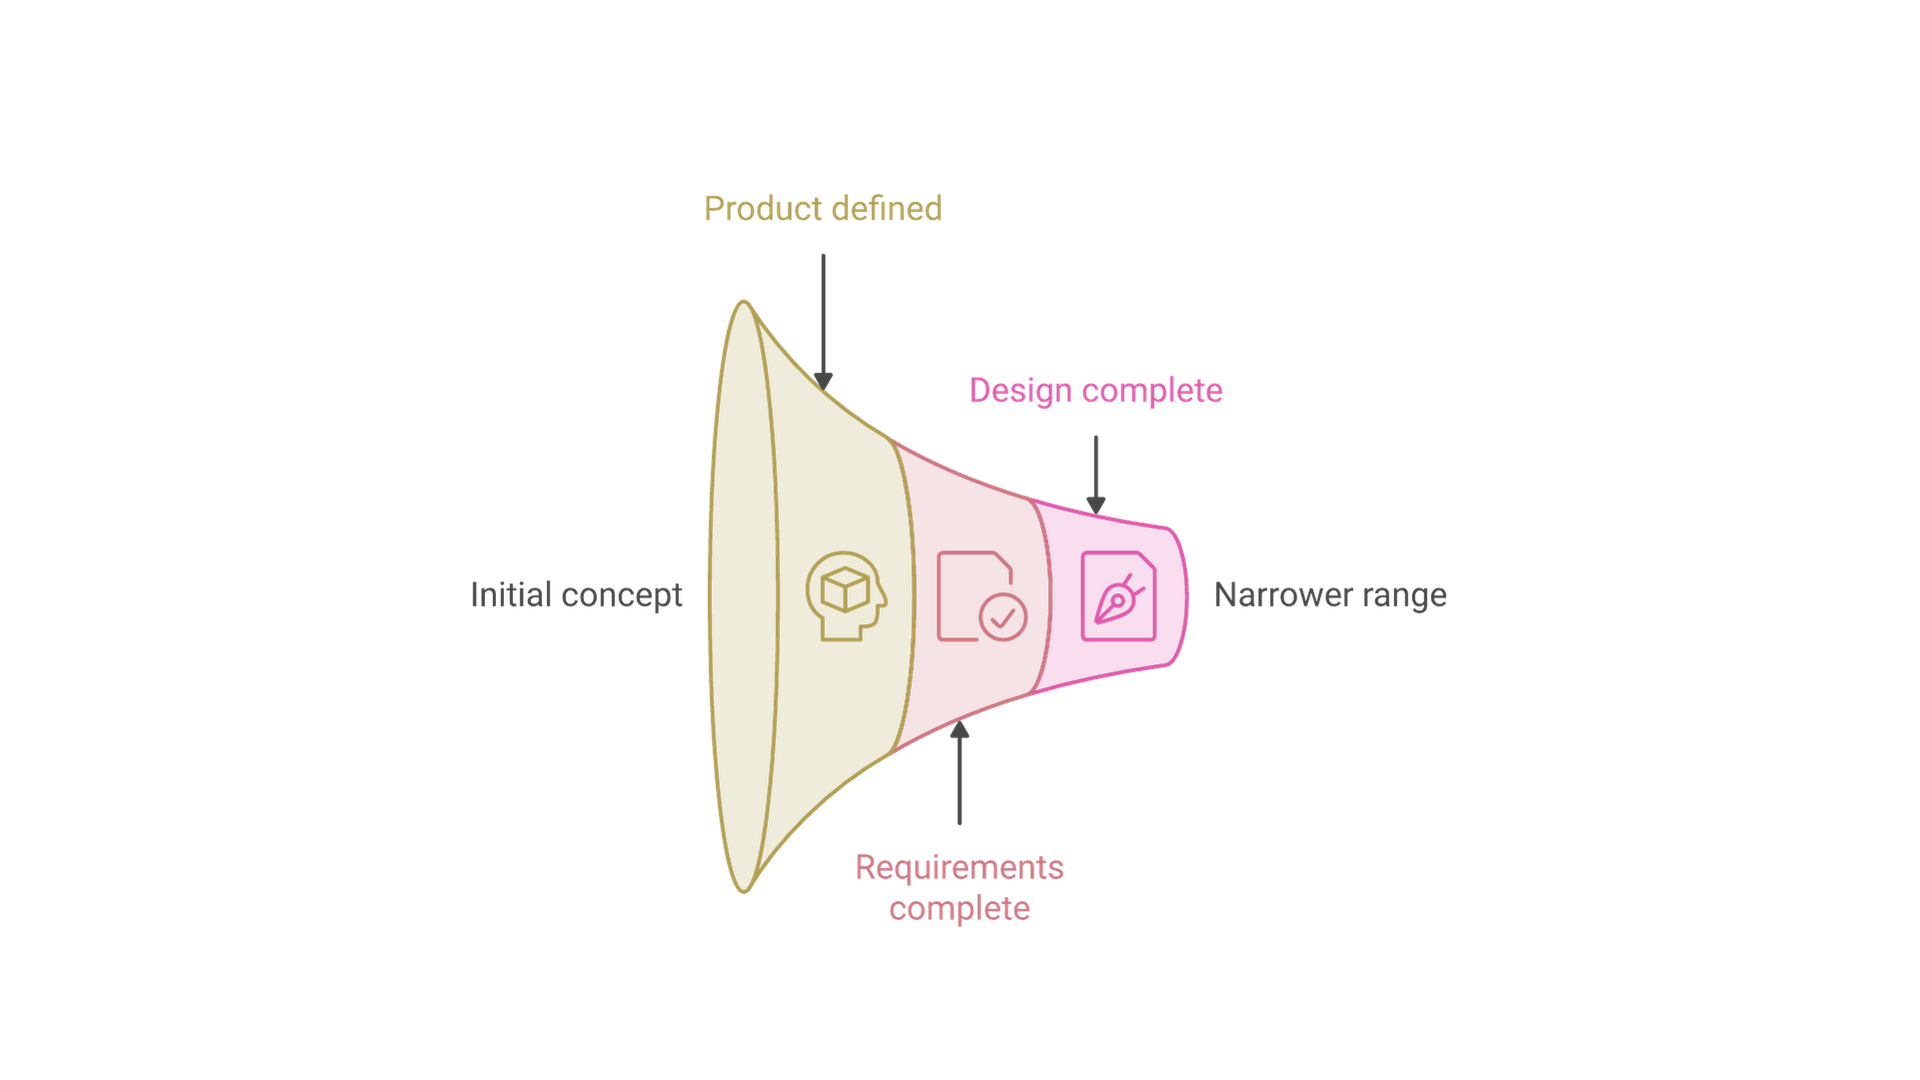
The cone of uncertainty describes how estimation error shrinks as a project's definition becomes clearer. Early in a project, requirements, solution design, staffing and plan details are unknown, so any estimate must carry wide variability. As those details are pinned down, the variability in the project, and therefore in its estimates, can decrease.
In Construx's white paper on the topic, Steve McConnell shows estimates at the initial concept stage ranging from 0.25x to 4x of the eventual actual outcome, a 16-fold spread between high and low. The range narrows at milestones such as approved product definition, requirements complete and user interface design complete (McConnell, "Software Development's Cone of Uncertainty," Construx). These multipliers illustrate a pattern rather than a law of nature; the origins of the specific numbers have been debated, so use them to frame conversations, not as precise statistics.
The Cone Narrows Only When You Make Decisions
McConnell stresses two points that matter for anyone presenting estimates. First, the cone represents the best case: skilled estimators can be less accurate than the cone, but not reliably more accurate. Second, the cone does not narrow on its own. Uncertainty shrinks only when the project makes decisions that remove variability, such as agreeing on the product vision, settling requirements (including what will not be built) and completing design. A project that keeps changing direction stays in a "cloud" of uncertainty rather than a cone.
What the Cone Means for Commitments
The cone gives a principled reason to avoid committing to a fixed price or date too early. McConnell's advice is to avoid commitments until the cone has narrowed enough to support them. In practice, that means funding a discovery phase, giving a range rather than a single number at the start, and re-estimating at each milestone. In agile delivery, the same logic applies at the release level: early forecasts are wide, and they tighten as the team establishes a velocity and the backlog stabilizes.
Best Practices for Improving Estimation Accuracy
Accurate cost estimation is a capability you build over time, not a formula you apply once. Using historical data, involving the whole team, documenting assumptions and reviewing estimates regularly all improve accuracy. Collaborative techniques such as Planning Poker and Wideband Delphi increase engagement and expose overlooked work. Delivery practices matter too: teams with automated testing, continuous integration and stable processes are more predictable, which our overview of modern software development best practices explains in more detail.
Investing in quality practices early reduces downstream rework, and drawing on the development team's expertise produces estimates that are more accurate and better aligned with how the work will actually be done, including an appropriate contingency and management reserve.
Use Historical Data
Historical data is the foundation of reliable estimation. Record estimated versus actual effort for each project and, where possible, for each major component. Over time, this lets you calibrate parametric models, choose better analogies and spot systematic optimism in particular kinds of work, such as integrations or data migration.
Comparing new budgets with past actuals also builds stakeholder trust, because you can show where numbers come from. When your own data is lacking for a new technology or service line, external benchmarks and published model defaults can help, but label them clearly as less reliable than your own history.
Involve the Entire Team
Engaging the people who will design, build, test and operate the software increases accuracy by drawing on diverse expertise. Collaborative estimates uncover tasks and complexities that a single estimator might miss, and they create shared ownership of the result. Useful habits include:
- Estimating independently first, then discussing differences
- Including testers, designers and operations staff, not only developers
- Reviewing past discrepancies between estimates and actuals
- Writing down assumptions next to every estimate
Document Assumptions and the Basis of Estimate
Every estimate rests on assumptions about scope, team, technology, dependencies and client responsibilities. Writing them down turns hidden risks into reviewable statements and makes it clear when a change in assumptions should trigger a change in the estimate. The U.S. Government Accountability Office's Cost Estimating and Assessment Guide (GAO-20-195G) treats ground rules and assumptions, sensitivity and risk analysis, documentation and updating estimates with actuals as core parts of a reliable estimating process, and it includes guidance specific to software cost estimating.
Regularly Review and Update Estimates
Key points about reviewing and monitoring estimates:
- Re-estimate at major milestones and whenever scope changes materially.
- Revise the project budget when new information shows the baseline is no longer realistic.
- Track progress and actual cost against the baseline throughout delivery.
Alignment with stakeholders on budgets and timelines requires clarity at the start and ongoing communication afterward. Regular updates and feedback loops keep estimates reflective of the project's current state, leading to better budget planning and fewer late surprises.
Managing Risks and Uncertainties in Cost Estimation
Effective management of risk and uncertainty is essential to meet cost, schedule and performance objectives. Uncertainty and risk analysis improve the usefulness of cost predictions by showing not just a most likely outcome but the range of plausible outcomes and what drives them. Probabilistic techniques such as Monte Carlo simulation model those uncertainties by repeatedly sampling from the ranges of individual estimates.
Clear estimates also help prevent scope creep by defining project boundaries, and continuous validation keeps the estimate aligned with actual progress and emerging information. Regular communication with stakeholders keeps everyone informed about changes and the reasons behind them.
Identifying Potential Risks
New projects bring estimation risks from new functionality, larger scale, unfamiliar architecture, new technology, third-party dependencies and unclear requirements. Qualitative techniques, such as risk workshops and checklists, and quantitative techniques, such as sensitivity analysis and probabilistic modeling, help evaluate the likelihood and impact of each risk.
Identifying risks early allows project managers to decide which to mitigate, which to accept and which to cover with contingency. Retiring the biggest technical risks first, through spikes, prototypes or proofs of concept, is one of the most effective ways to narrow the cone of uncertainty.
Allocating Contingency Funds
Longer timelines introduce more risk and more unknowns. Accounting for them requires explicit budget adjustments: a contingency reserve for identified risks and, in many organizations, a management reserve for unknown unknowns. Contingency should be sized from the risk analysis rather than added as an arbitrary percentage, and the plan should state how and by whom it can be released.
Statistical methods help here. If you have three-point estimates or a Monte Carlo simulation, the difference between the expected value and a higher-confidence value gives a reasoned basis for contingency. Adjusting cost driver ratings to reflect real project complexity and calibrating with relevant data further improves reliability.
Scenario Planning
Scenario planning prepares for different outcomes and their financial impact. Typical scenarios include a reduced-scope minimum viable product, the planned scope, and the planned scope with a major risk materializing. Monte Carlo simulation can model these scenarios by combining the uncertainty of many tasks into a distribution of total cost or completion dates.
Planning for multiple scenarios lets decision-makers see the financial implications of their choices, decide which features are essential and agree in advance on what will be cut if a risk occurs. It reduces risk, supports budget adjustments and improves decision-making throughout the project.
How to Present and Communicate Cost Estimates to Stakeholders
An estimate is only useful if the people relying on it understand what it means. Effective communication builds trust and manages expectations, and a well-documented estimate serves as a baseline for later conversations about scope, budget and timeline. Many estimation problems are really communication problems: a range was presented as a promise, or an early guess was remembered as a commitment.
Clear and transparent reporting gives stakeholders a basis for discussing scope and deliverables, and engaging them throughout the lifecycle ensures the estimate keeps reflecting their priorities.
Separate Estimates, Targets and Commitments
Three different things often share the word "estimate." An estimate is an analytical prediction of what the work will take. A target is a business goal, such as a launch date or budget ceiling. A commitment is a promise to deliver defined scope by a date for a price. Keeping them separate lets teams say honestly when a target is unlikely and offer options, such as reducing scope or extending time, instead of quietly absorbing an unrealistic number.
Clear and Transparent Reporting
Transparency in cost estimates improves support and satisfaction. A good estimate presentation includes:
- A range with a stated confidence level, not a single figure
- The scope included and explicitly excluded
- Key assumptions and dependencies
- The main risks and the contingency covering them
- The methods used and how they were cross-checked
Sharing a preliminary budget with stakeholders and the project team is a way to gather feedback on areas that may be unrealistic or misaligned with priorities. Business analysts help by producing a feature list that ties each cost element to a requirement, which makes the estimate traceable and easier to adjust when priorities change.
Setting Realistic Expectations
Setting realistic expectations for cost and schedule is critical. Use the cone of uncertainty to explain why early numbers are wide and how they will narrow as decisions are made. Make clear which decisions the stakeholders themselves control, such as approving requirements or limiting change requests, because those decisions are what allow the range to tighten.
Avoid presenting more precision than the estimate contains. A figure quoted to the dollar at the concept stage implies a certainty that does not exist. Rounded ranges communicate both the expected cost and the uncertainty around it.
Regular Updates and Feedback Loops
Engaging stakeholders throughout the project lifecycle builds trust and ensures their needs are met. Report progress against the baseline at a regular cadence, explain variances and show the updated forecast. Collaboration between the delivery team and stakeholders improves the accuracy of later estimates and strengthens buy-in. Continuous review based on new information is what keeps projections realistic.
Applying Cost Estimation to Common Project Types
The same techniques apply across project types, but the dominant cost drivers differ. Rather than relying on generic price ranges, which vary widely with scope, team location and engagement model, focus on the drivers that most affect your estimate and use your own historical data or calibrated models to price them.
Comparable past projects remain the most practical reference point. Analyzing them helps project managers produce more accurate estimates and better outcomes across web, mobile and enterprise work.
Web Development Projects
Web projects range from content sites to complex web applications. The main cost drivers are the number of distinct user flows and page templates, integrations with payment, identity or CRM systems, content migration, accessibility and performance requirements, and the administrative tools needed to run the site. Small changes, such as bug fixes, suit bottom-up task estimates; larger builds benefit from function points or analogy at the start and bottom-up estimates once design is complete.
Mobile Application Development
Mobile projects add platform choices (native iOS and Android or a cross-platform framework), device and operating system coverage, offline behavior, push notifications, app store review and the backend services the app depends on. A proof of concept should be estimated separately from a production release, because production apps require security hardening, analytics, monitoring and support processes that a prototype can skip.
Enterprise Software Solutions
Enterprise software estimation requires a deep understanding of scope, the technology stack, team capabilities and organizational constraints. Complexity grows with the number of integrations, data migration needs, security and compliance requirements, user roles and legacy systems. These projects benefit most from a structured approach: a discovery phase to narrow the cone, function point or parametric sizing, and bottom-up estimates with three-point values for detailed planning.
Costs also vary with the location of the development team and the engagement model, such as fixed price, time and materials, or a dedicated team. Regular communication and aligned expectations between stakeholders and developers reduce delivery risk. If you are planning a build of this kind, our custom software development team can help turn the estimate into a delivery plan.
Whichever project type you are estimating, combining parametric, analogous and bottom-up methods improves accuracy and gives you a way to cross-check the final number.
Frequently Asked Questions
Why is accurate software cost estimation important?
Accurate estimates support budget management, resource allocation and stakeholder trust. They help decide whether a project is worth funding, reduce the risk of overruns and missed deadlines, and provide a baseline for tracking progress.
What are the main techniques for software cost estimation?
The core techniques are analogous, parametric and bottom-up estimation. Teams commonly add three-point or PERT estimation, expert judgment with Wideband Delphi, function point analysis and story points with Planning Poker.
What is the PERT formula for three-point estimation?
The PERT weighted average is (Optimistic + 4 × Most likely + Pessimistic) / 6, and its standard deviation is commonly approximated as (Pessimistic − Optimistic) / 6. The simple triangular average divides the sum of the three values by 3.
How can historical data improve cost estimation accuracy?
Historical estimated-versus-actual data lets you calibrate parametric models, pick better analogies and correct systematic optimism. It also makes estimates easier to defend, because stakeholders can see where the numbers come from.
What role do COCOMO II and Planning Poker play in cost estimation?
COCOMO II is a parametric model that converts a size estimate and cost drivers into effort and schedule. Planning Poker is a team technique for relative sizing with story points. They suit different stages and can be used together.
How should project managers communicate cost estimates to stakeholders?
Present a range with a confidence level, list scope, assumptions and risks, separate estimates from targets and commitments, and update the forecast regularly as the cone of uncertainty narrows.
Conclusion: Building Software Cost Estimates You Can Trust
Accurate software cost estimation is fundamental to successful software projects. No single method is enough: analogy gives a fast early range, parametric models such as COCOMO II and function point analysis add a measurable basis, bottom-up estimates with three-point values support detailed planning, and story points with velocity keep agile forecasts honest once delivery begins.
The most reliable estimates share the same habits. They are built from historical data, cross-checked with more than one method, expressed as ranges, backed by documented assumptions and contingency, and updated as the cone of uncertainty narrows. Communicating them clearly, and separating estimates from targets and commitments, turns a number into a decision tool.
If you need an independent estimate, a discovery phase to narrow the range or a delivery partner to build against a realistic budget, contact Cognativ to discuss your software project.